Cesky: |
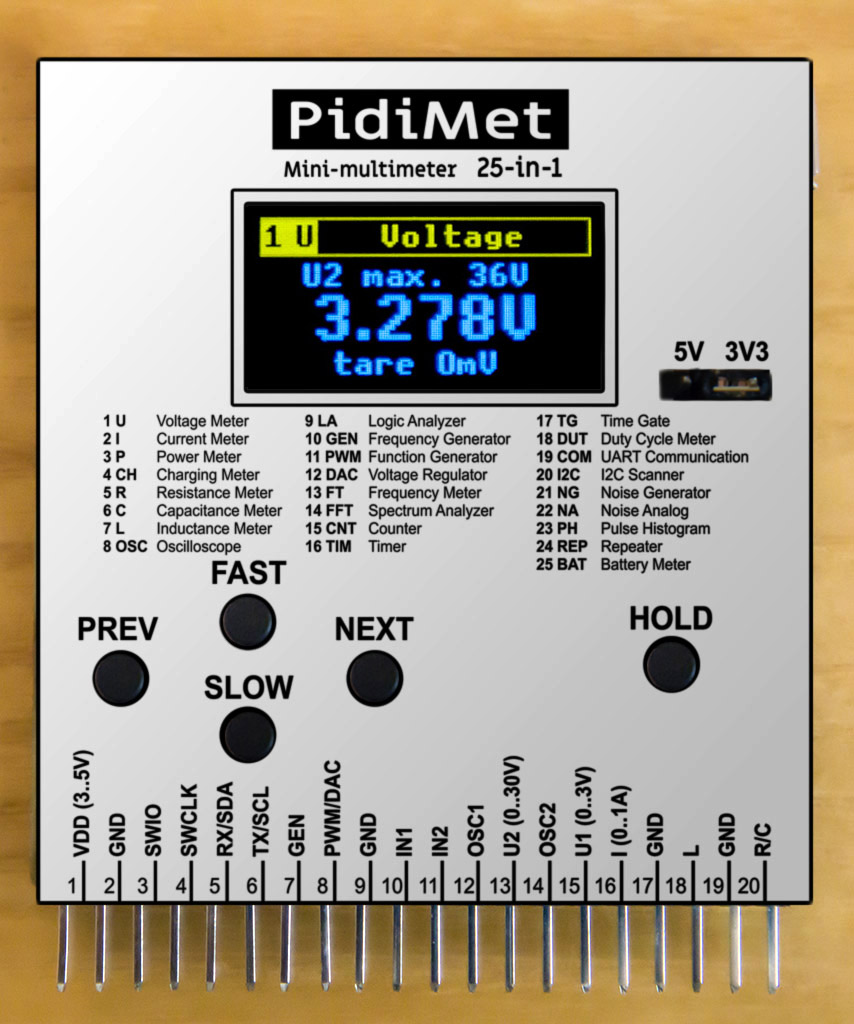
PidiMet
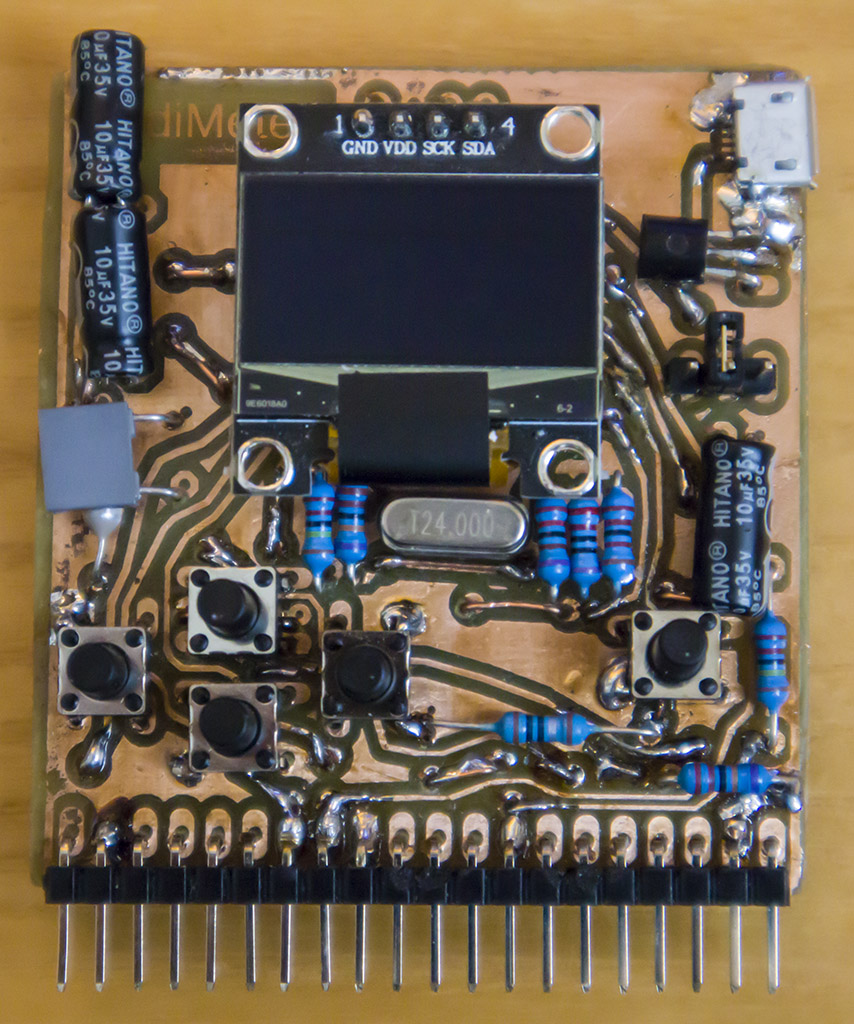
Small universal multimeter with 25 functions and CH32V006 processor
Version 1.0; Last update: 01/27/2026
>>> Download resources of PidiMet <<<
PidiMet on GitHub: github.com/Panda381/PidiMet
PidiMet part of library CH32LibSDK
Library CH32LibSDK on GitHub: github.com/Panda381/CH32LibSDK
Contents
PidiMet is small, low-cost, universal multimeter with 25 functions and CH32V006 processor. It includes measure of voltage, current, power, charging, resistance, capacitance, inductance, oscilloscope, logic analyzer, frequency generator, function generator, voltage regulator, frequency meter, spectrum analyzer, counter, timer, time gate, duty cycle, UART communication, I2C scanner, noise generator, analog noise, pulse histogram, repeater, and battery meter.
Although it is not a precise and perfect device, it can be very useful in amateur practice as a basic measuring and testing device. For analog functions, the accuracy is usually in the range of 5 to 10%, for digital functions around 50ppm, which is sufficient for normal amateur practice. The dimensions of the PidiMet are 55x60 mm.
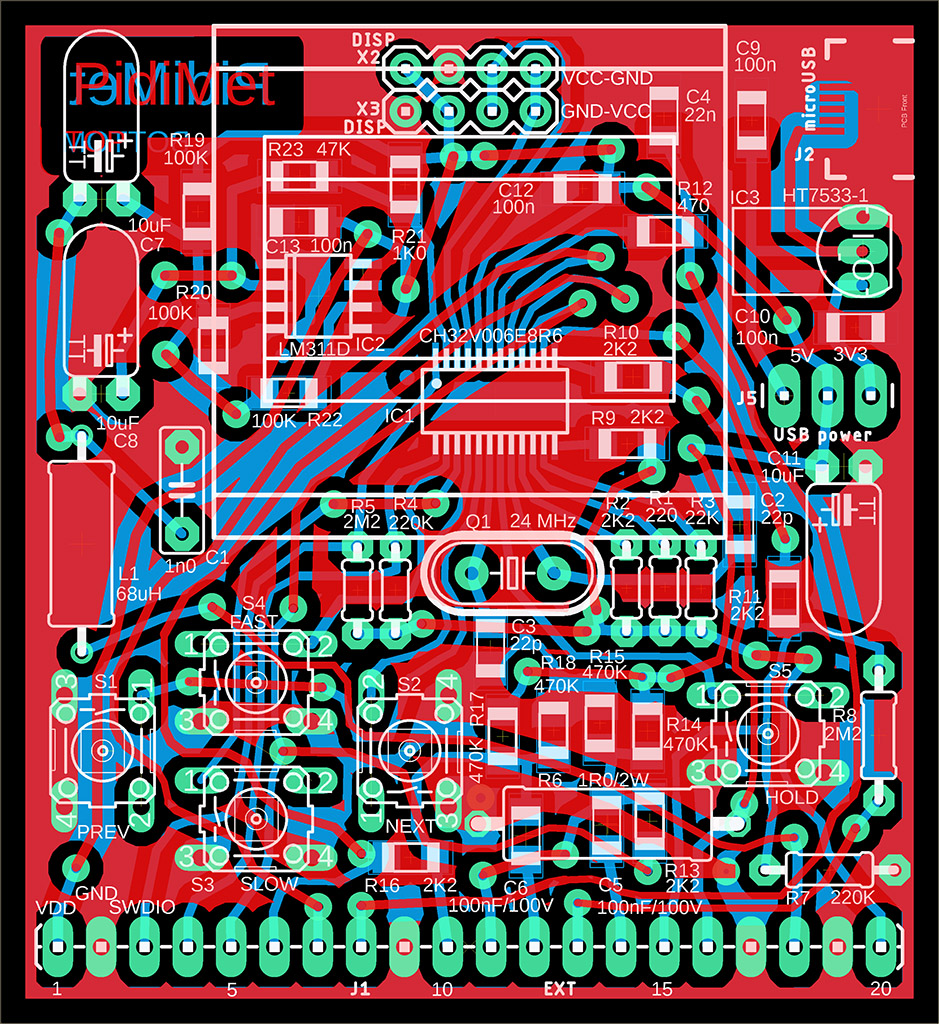
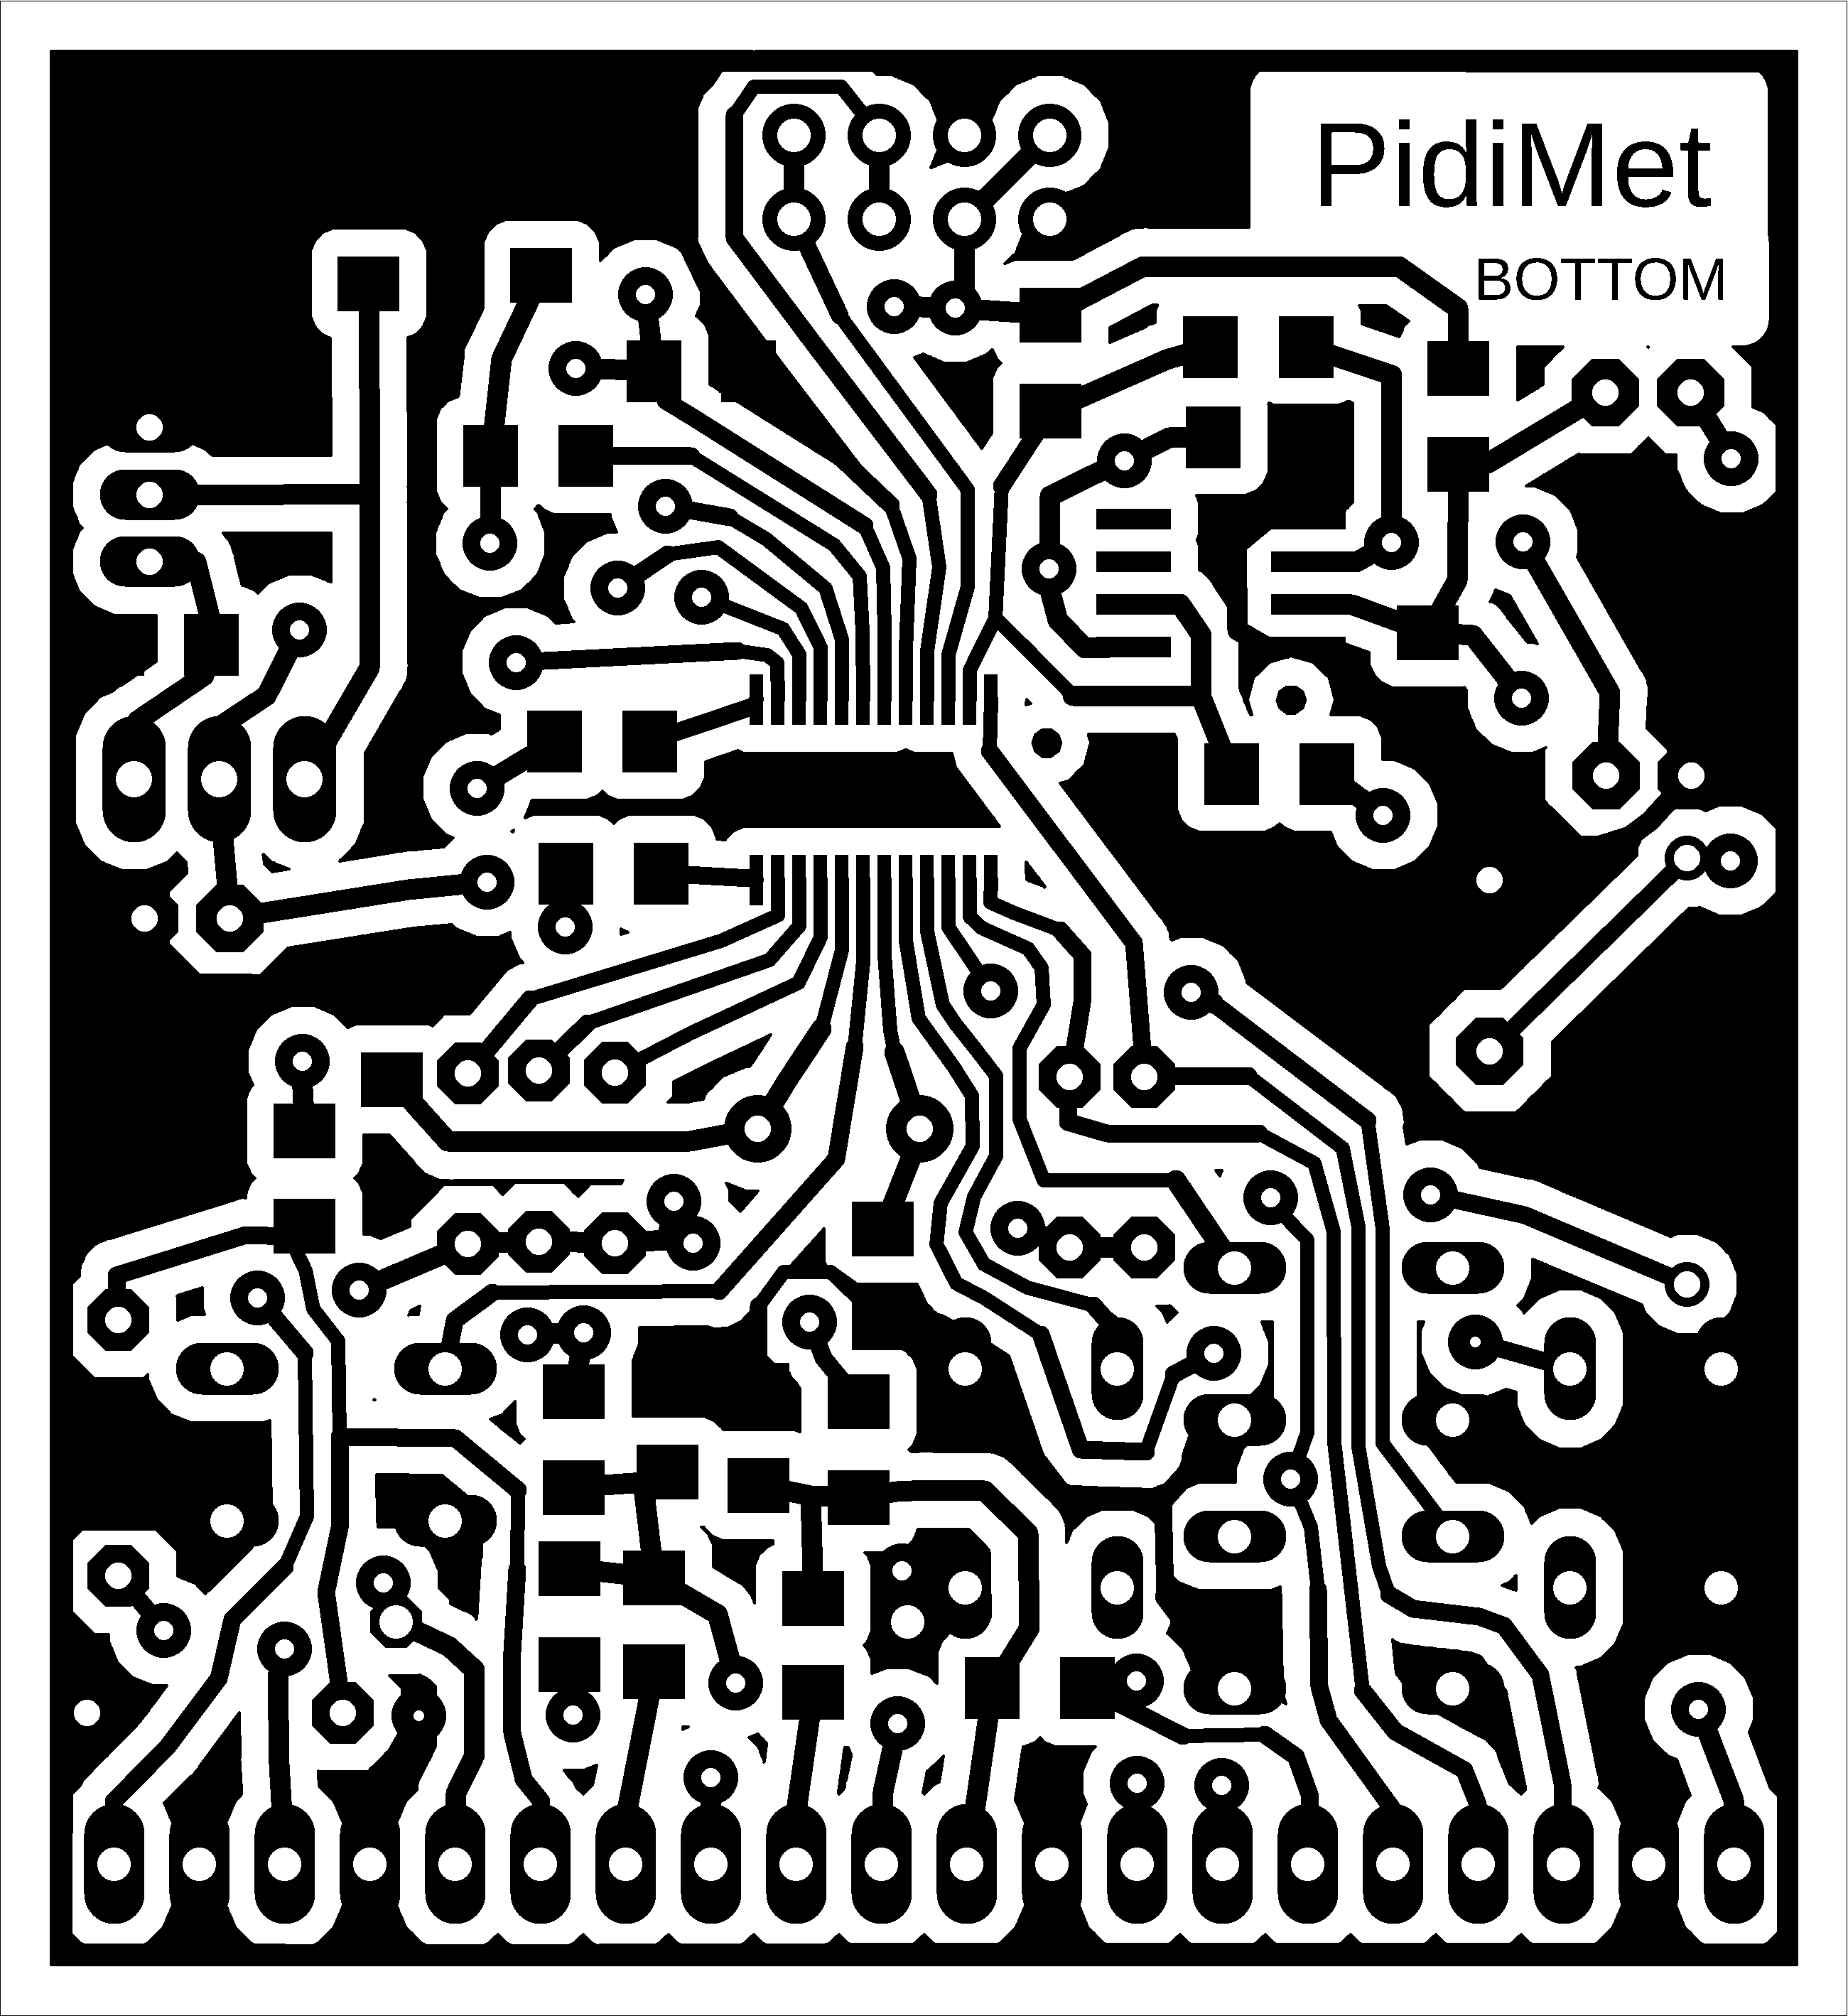
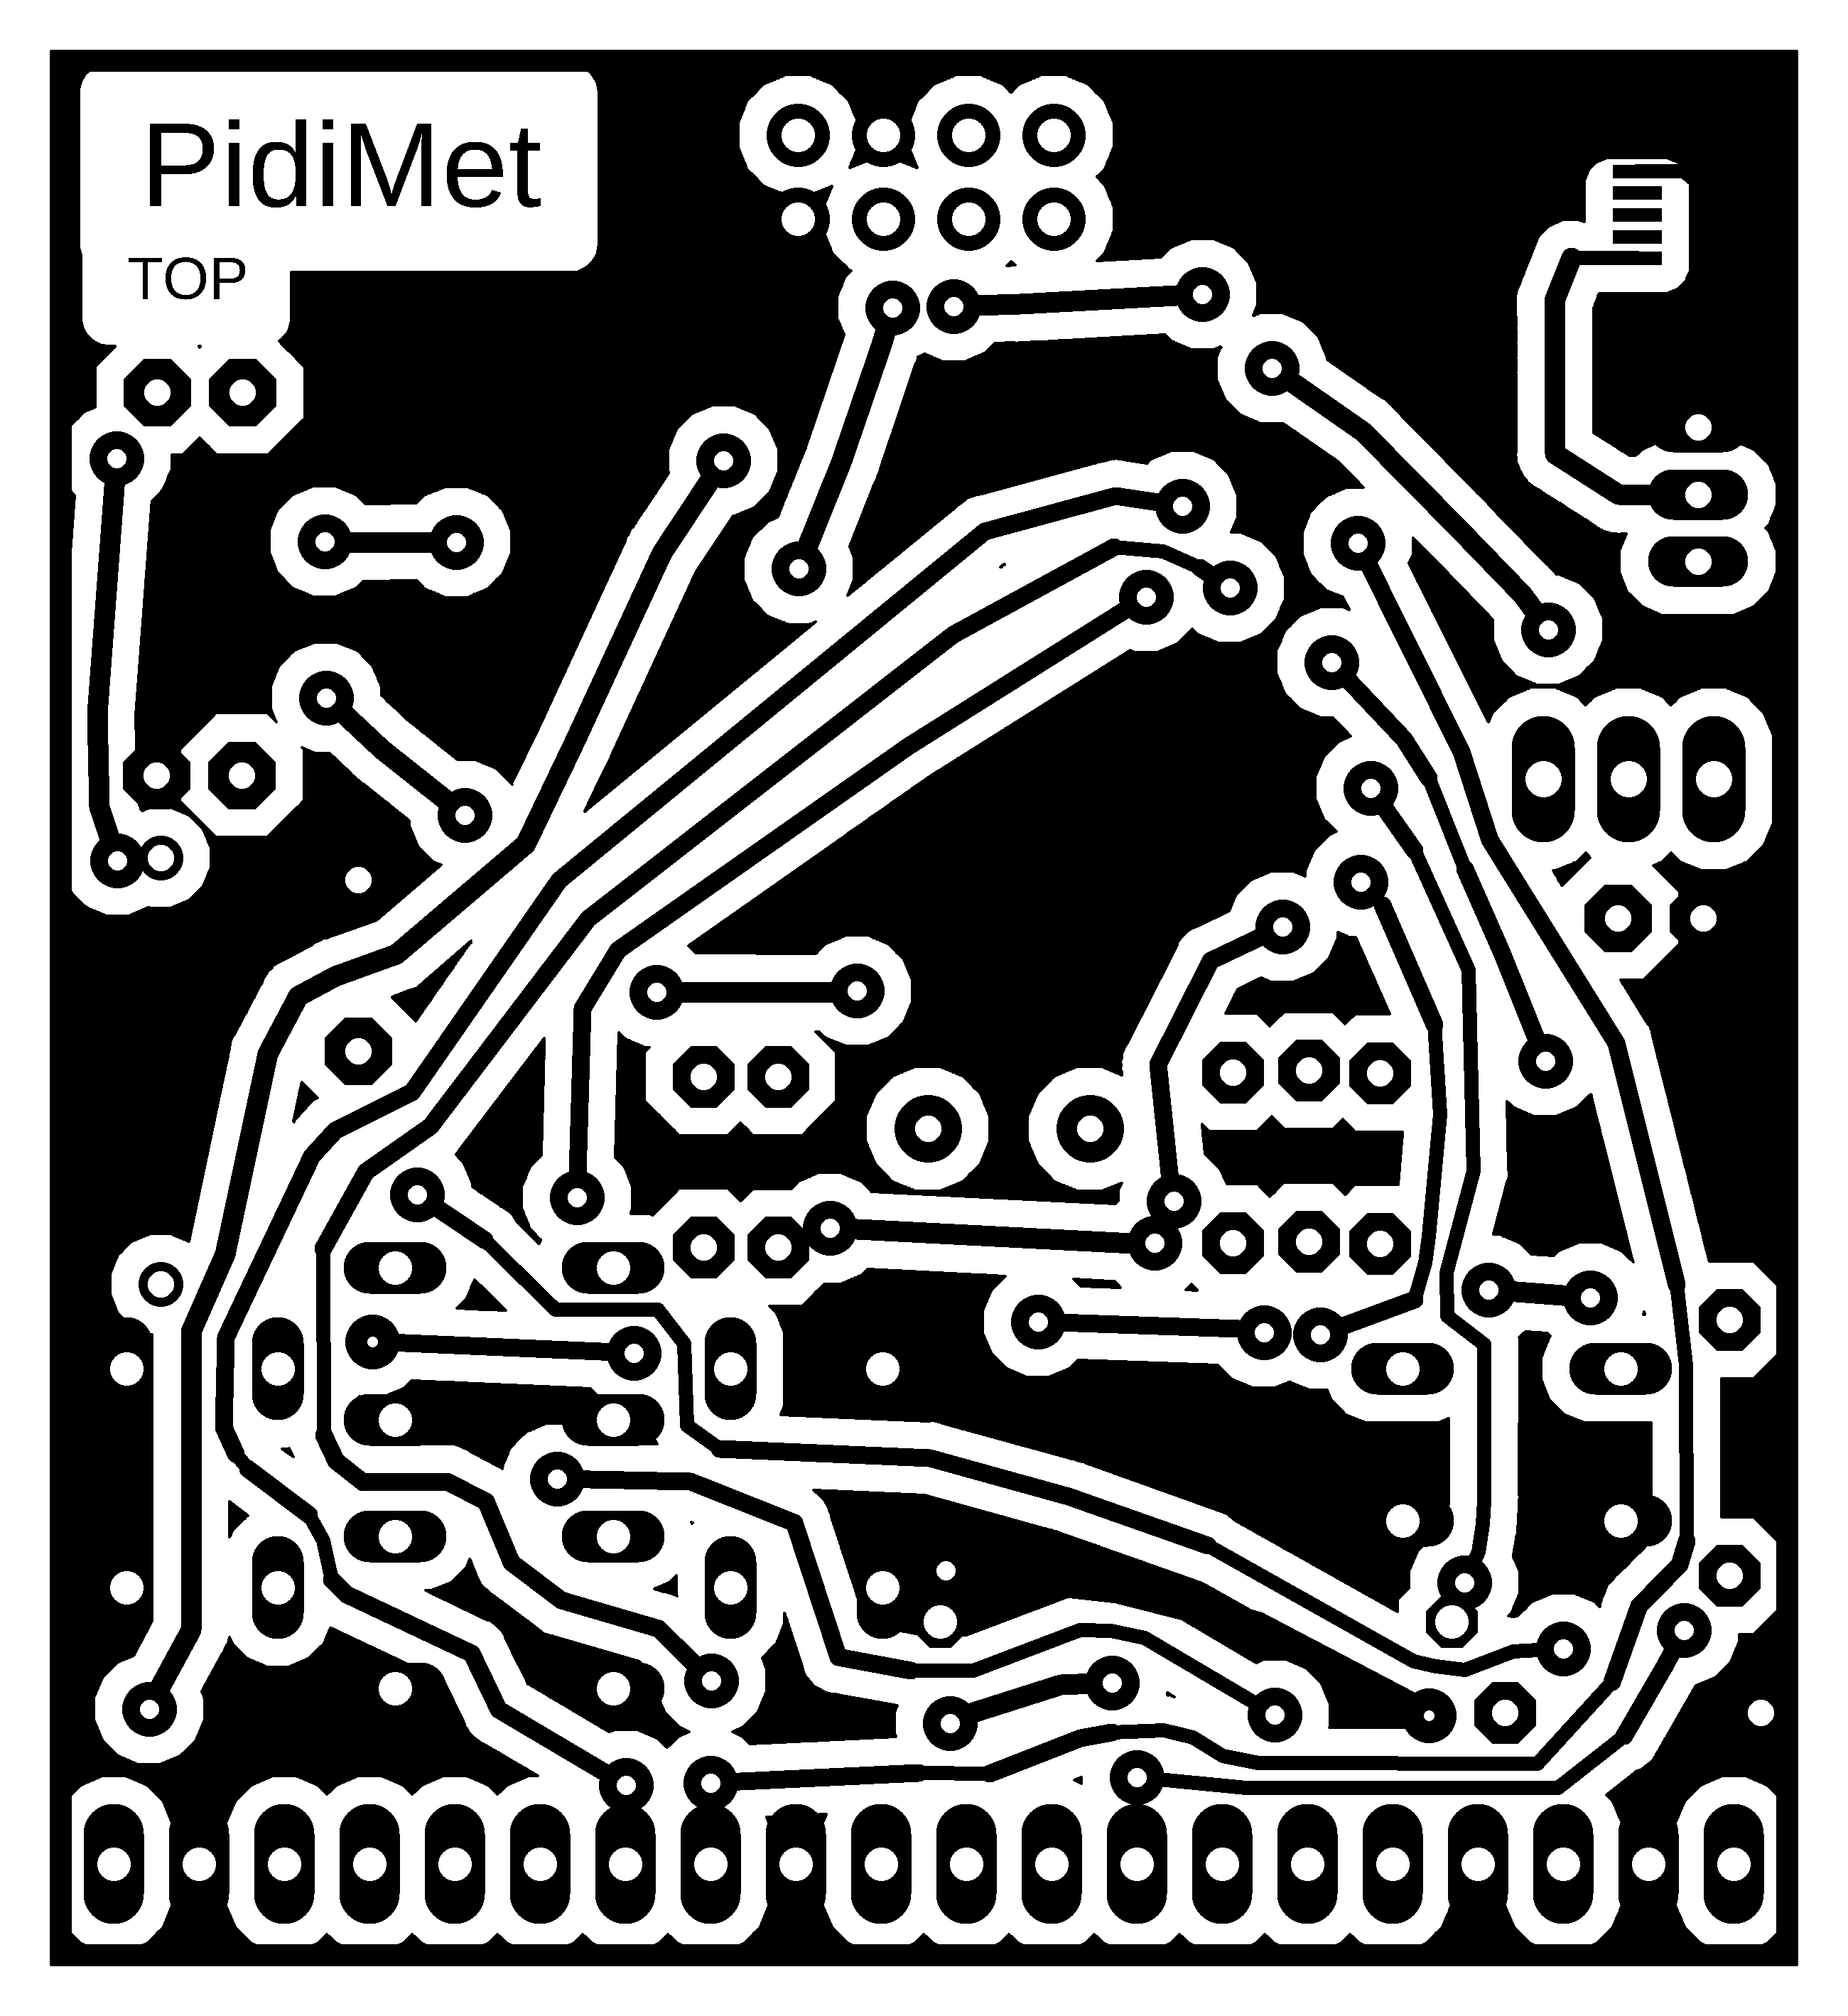
PidiMet requires the CH32LibSDK library for compilation and is included in the library as a sample application. Schematics and printed circuit boards are in Eagle 9.2.0 Free format.
PidiMet can be powered either from an external 5V USB source or via an external universal connector with an external voltage in the range of 3 to 5V, through the VDD pin. When powered from a USB source, it is possible to select 3.3V or 5V power supply using the "USB Power" jumper. When working with signals, it is important to remember that PidiMet must be switched to the same voltage as the tested device. If you select 3.3V power supply and input signals with 5V levels, there is a risk of damaging PidiMet. Conversely, if you select 5V power and the device under test is 3.3V, there is a risk of damage to the device under test. If you are unsure, it is advisable to power the PidiMet from the device under test via the VDD pin.
If it is necessary to measure the current inside the device circuits, it may be necessary to power the PidiMet from a separate 5V charger to ensure a floating ground, as the current is measured against the GND ground in the PidiMet. Alternatively, the PidiMet can be powered from a battery with a 3.3V converter, which also ensures an isolated ground.
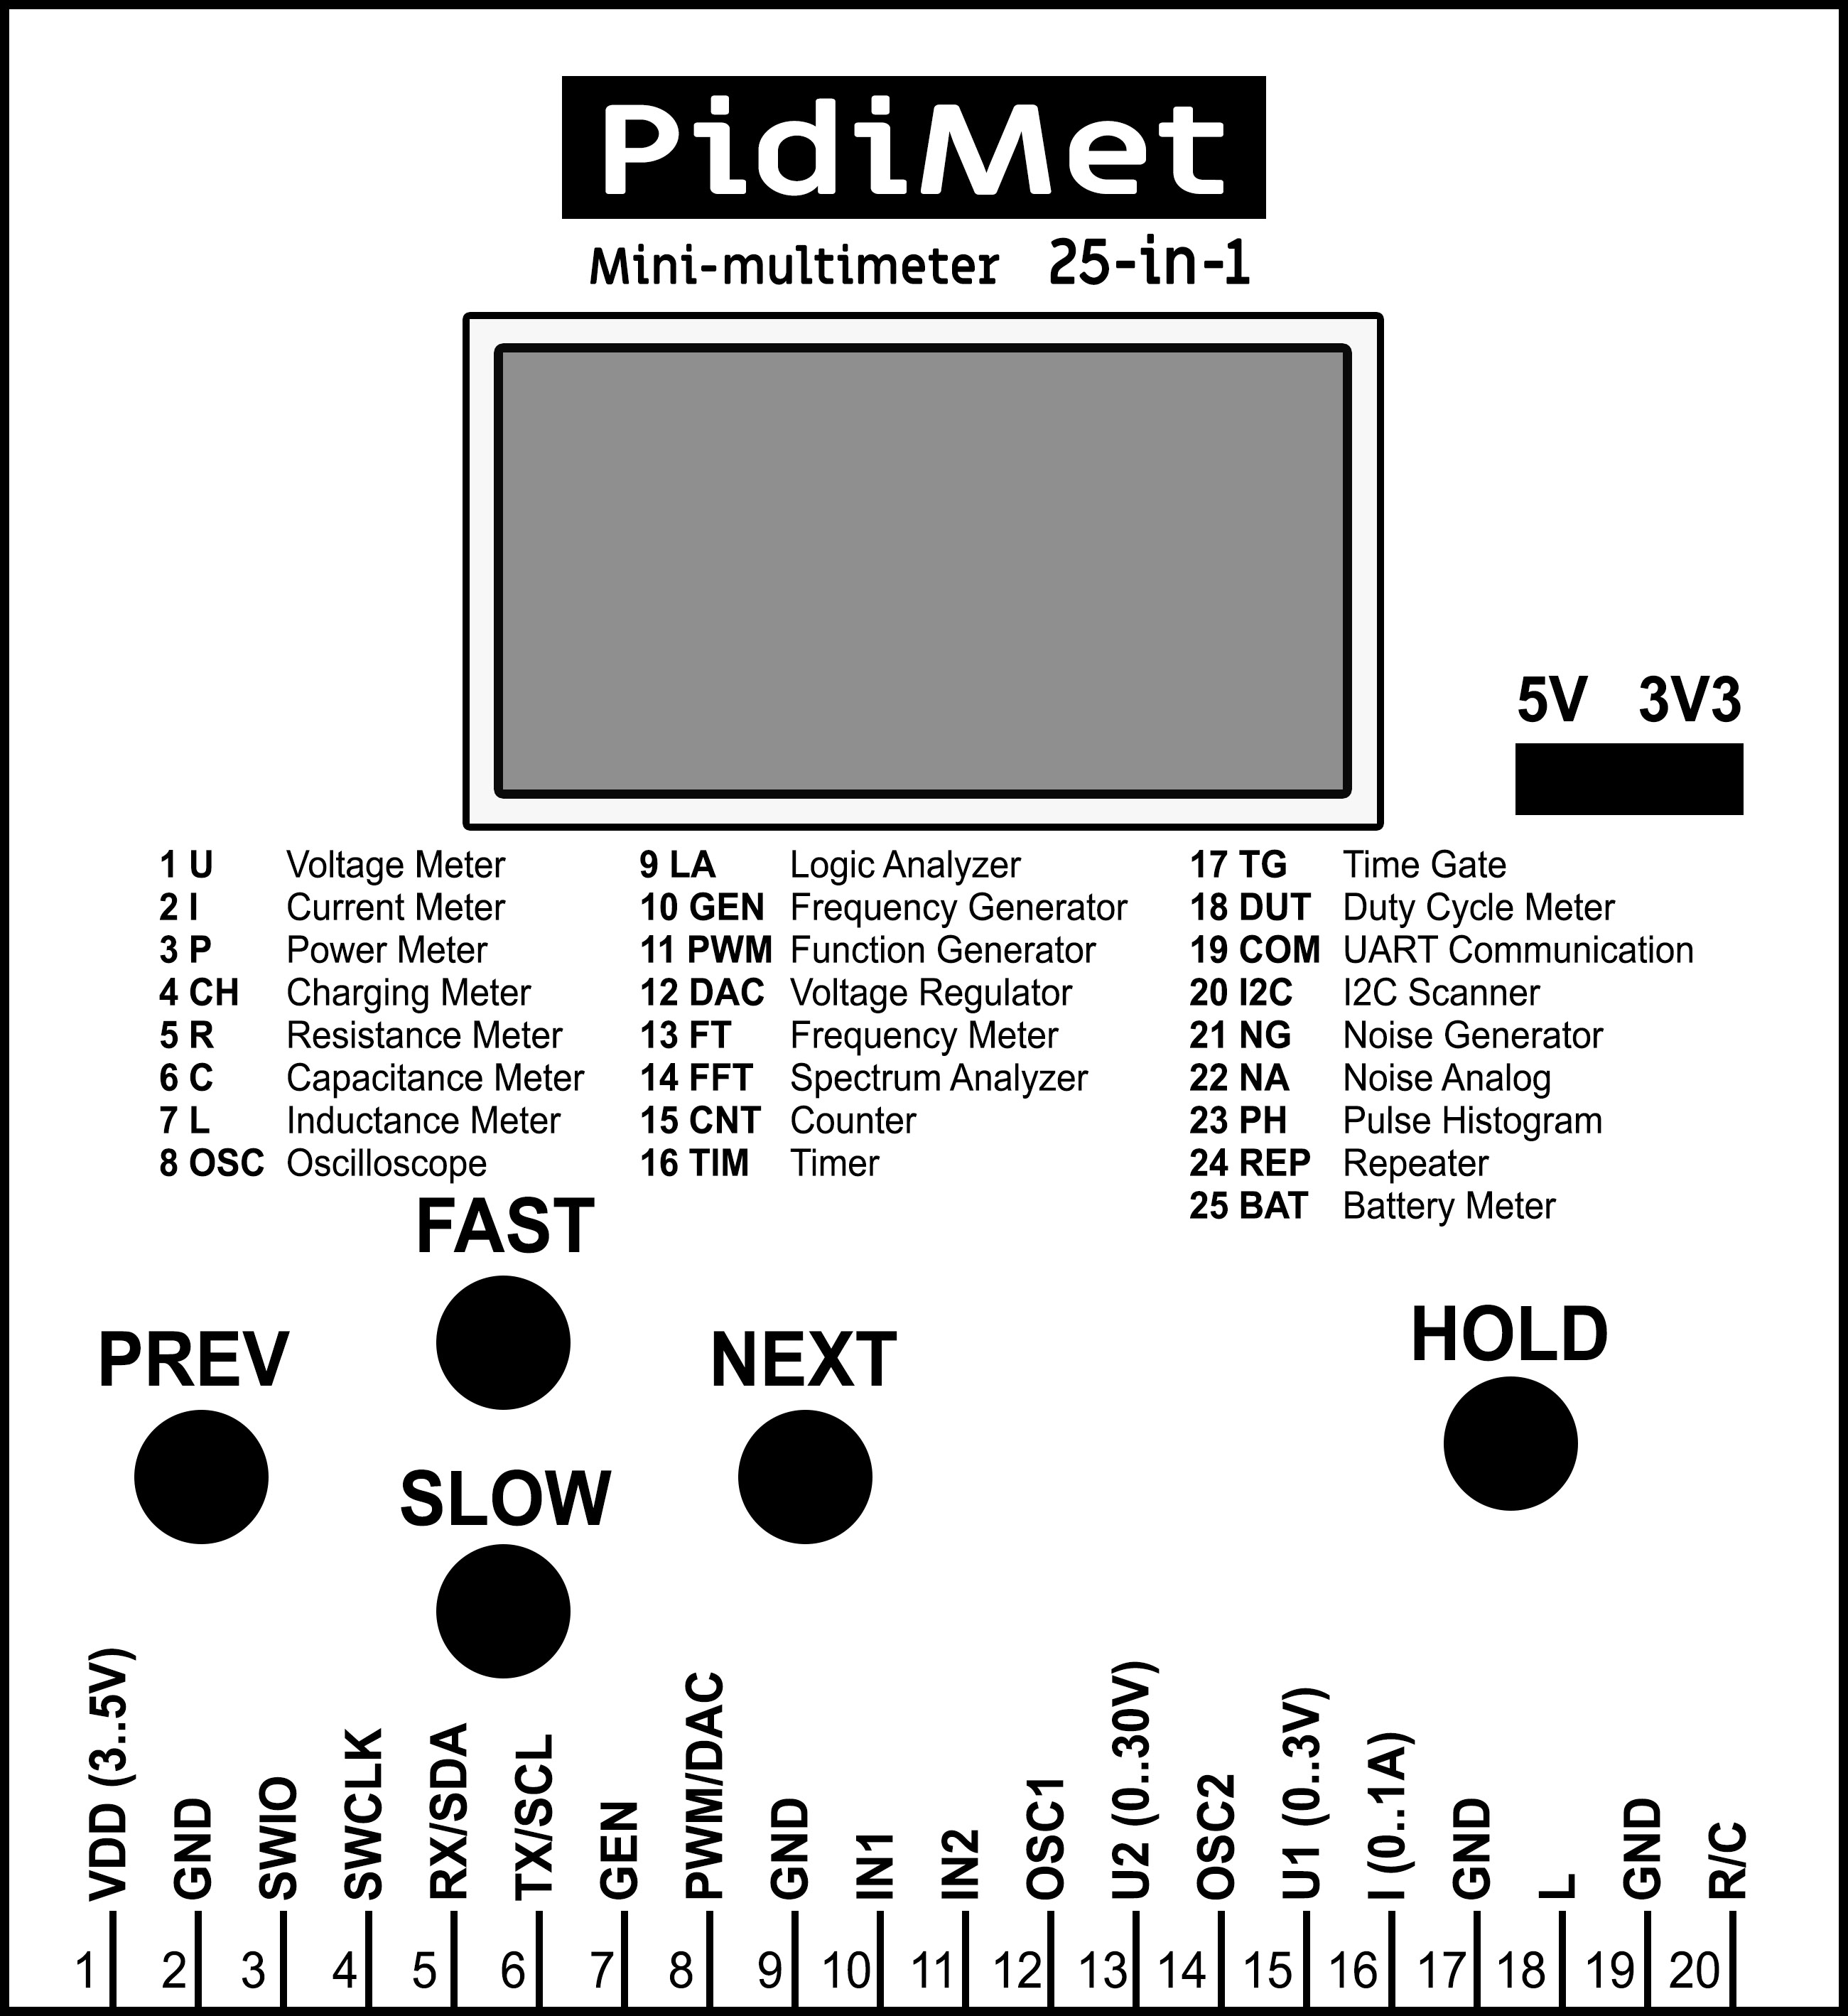
Functions are switched in PidiMet using the PREV and NEXT buttons - you can select one of 25 functions, a detailed list of which is provided below. The FAST, SLOW, and HOLD buttons have different meanings depending on the selected function. Test cables are connected to the PidiMet using an adapter via a 20-pin connector with a pin strip. This allows for easy cable replacement according to the selected function by simply changing the adapter.
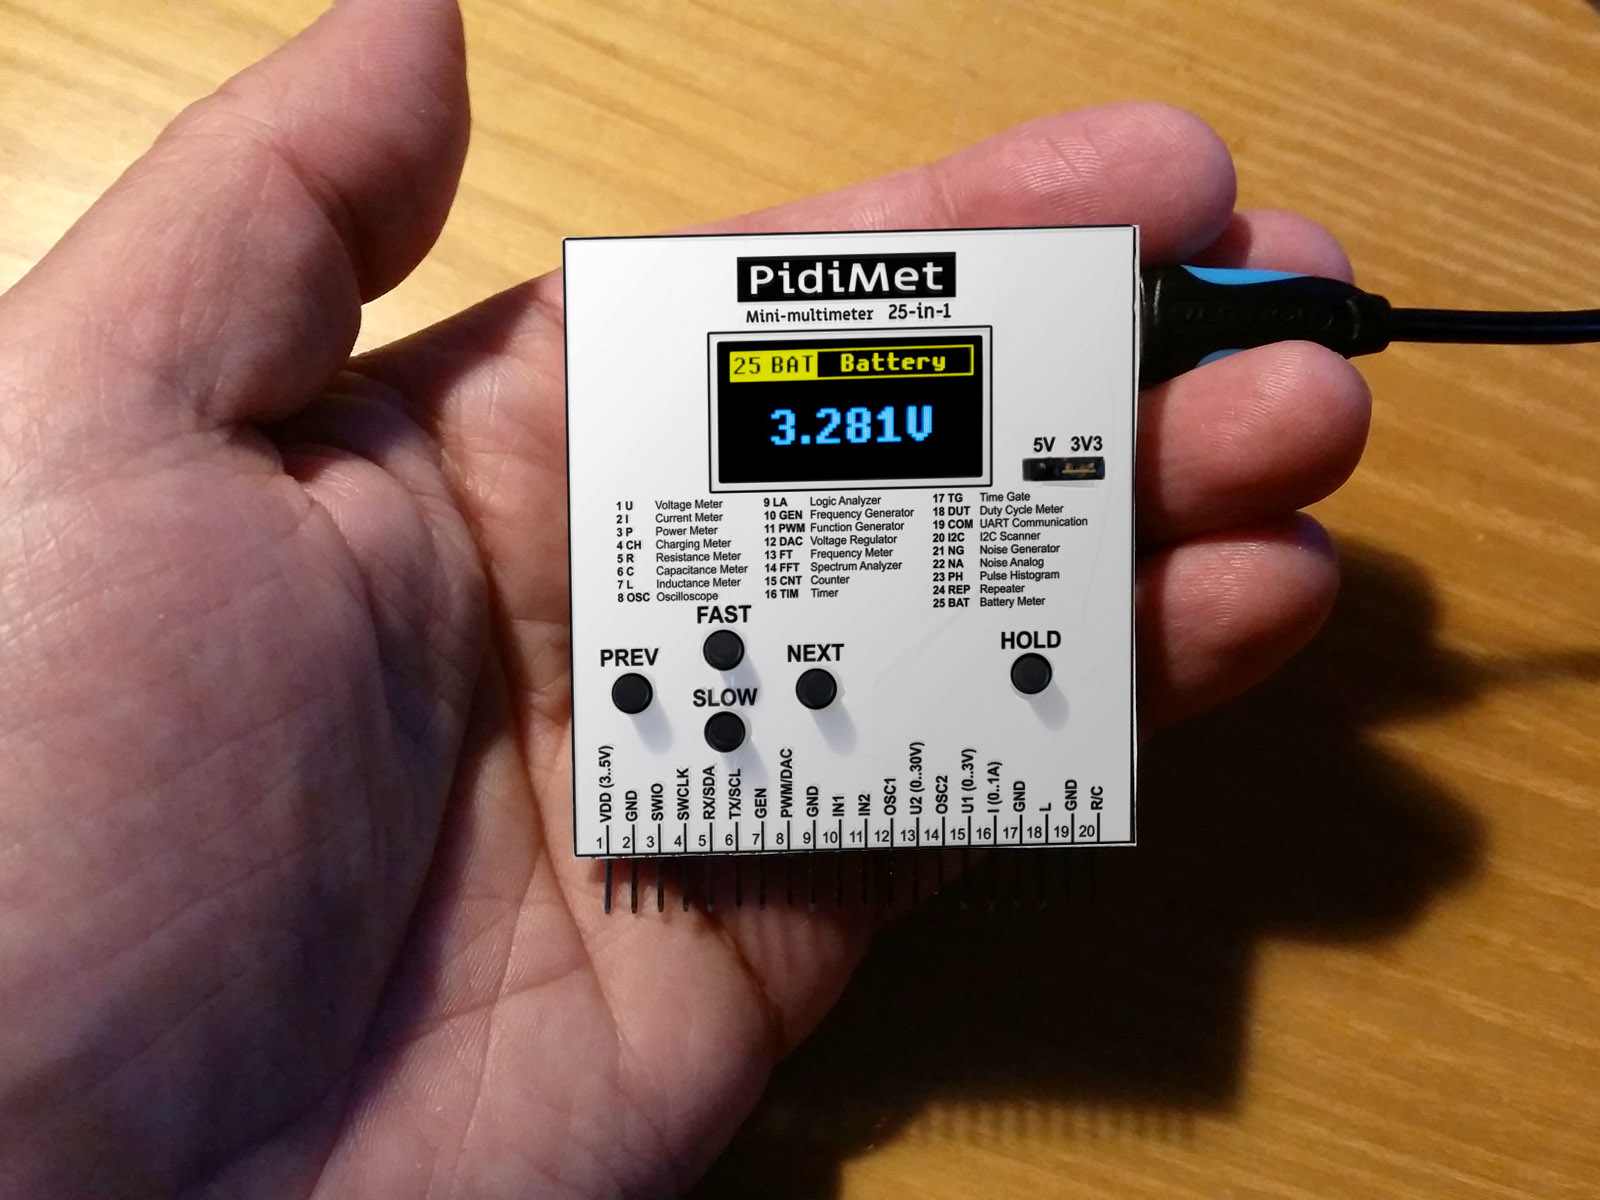
After turning on the PidiMet power supply, a message about the current power supply voltage will appear on the display for a moment. It is advisable to note this information - to check that the power supply has not been accidentally switched to the wrong power supply, which could damage either the PidiMet or the device under test.

Due to the simplicity of PidiMet, errors may occur that need to be pointed out. The processor itself is susceptible to unwanted external pulses and high frequencies. When handling PidiMet, an accidental pulse with a higher voltage than the internal power supply may reach the contacts - a typical case is electrostatic pulses. PidiMet should not be damaged in most cases – there are protective resistors on the inputs and the processor contains protective diodes. However, if these pulses reach the power supply branch, they can cause the processor to malfunction. This may manifest itself in the processor freezing or exhibiting unusual behavior. In such a case, it may be necessary to reset the PidiMet by disconnecting the power supply. For the same reason, the firmware contains an active watchdog - if the processor does not respond for 3 seconds, the watchdog resets the processor. In such a case, an emergency reset message appears on the display:

Another manifestation of incorrect behavior (e.g., after incorrectly connecting 5V to the input with a 3.3V power supply) may be that the crystal does not start. In this case, PidiMet will display a warning that the crystal is not working when it starts up. PidiMet works even without a crystal, using the internal 24 MHz HSI clock source, but the accuracy of time measurements (including capacitor and coil measurements) will decrease by 1%. In this case, turning PidiMet off and on again will help. The same message will appear when PidiMet is turned on if the crystal is not installed at all. PidiMet can still be used, but it will have lower accuracy.

In addition to random pulses, the processor may also crash due to high frequency. This can happen, for example, when generating frequencies of 24 MHz and 48 MHz (especially with a 5V power supply) or when such frequencies are applied to the input. The reason may be an incorrect PCB design. The printed circuit board was designed only for prototype development purposes and may not properly handle signal connections. If you are skilled at designing printed circuit boards, I recommend designing your own printed circuit board with a better design. This may eliminate errors related to high frequencies.
Functions are switched in PidiMet using the PREV and NEXT buttons. A detailed list and description of functions follows.
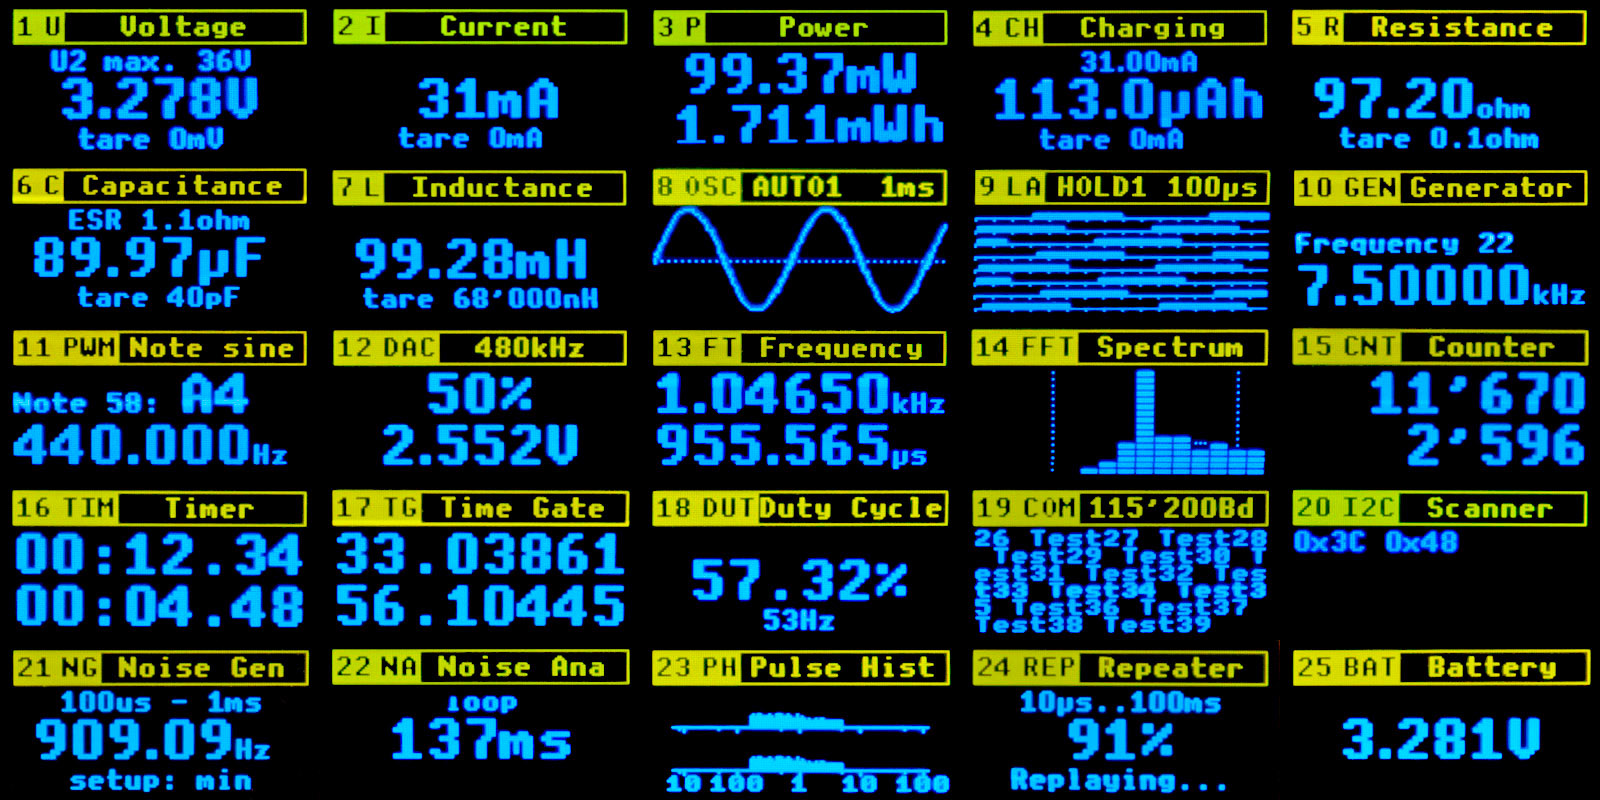
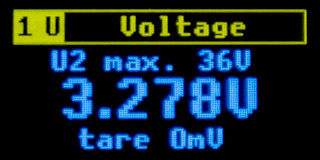
1 U Voltage - Voltage measurement. Voltage can be measured at 2 connector inputs. At input "15 U1", positive voltage can be measured in the range from zero to the supply voltage VDD. If PidiMet is switched to 3.3V, voltage up to 3.3V can be measured. If it is switched to 5V, voltages up to 5V can be measured. The upper row shows the voltage that can be measured. The value is derived from the current supply voltage, so it may vary. Negative voltages cannot be measured - in this case, 0V will remain on the display and there is a risk of damage to the PidiMet. At the "13 U2" input, positive voltages in the range from zero to 11 times the VDD supply voltage can be measured. The maximum measurable voltage is again displayed on the top row of the display. For safety reasons, to prevent damage to the PidiMet by failing to select the correct power supply, measurements up to 3V are typically specified for input U1 and measurements up to 30V for input U2. Applying 5V to U1 or 50V to U2 with a 3.3V power supply may damage the PidiMet.
However, PidiMet cannot recognize which pin is used to measure voltage, nor can it switch inputs. Measurements are performed via an input divider with 2M2 and 220K resistors. It is necessary to connect the measured voltage to the correct connector pin and switch the range in PidiMet. The FAST button selects input U2, and the SLOW button selects input U1. Changing the input only changes the multiplication coefficient of the measured voltage. Input U1 loads the measured circuit with an input impedance of 220 Kohm. Input U2 loads the measured circuit with an input impedance of 2.2 Mohm.
Voltage measurement is performed using an ADC converter, utilizing the processor's internal voltage reference. The accuracy of the voltage reference is typically around 1%. Any inaccuracy of the resistors in the input divider must also be added to the reference error. Another error is caused by the non-linearity of the ADC converter. Therefore, a relative accuracy of around 5% can realistically be expected. The absolute error of input U1 is 3 mV and the minimum measurable voltage is 1 mV. The absolute error of input U2 is 30 mV and the minimum measurable voltage is 10 mV. The voltage measurement time is approximately 500 ms - during the measurement time, the measured data is integrated to filter out noise.
When measuring small voltages, it may be necessary to perform "taring". The ADC converter may exhibit deviations, manifested by the indication of a small voltage even when the wires are disconnected. Disconnect the measuring wires, preferably by completely disconnecting the measuring adapter. Press the HOLD button - PidiMet will remember the current voltage value and subtract this value from the measured value. Inputs U1 and U2 each have their own tare value. The current "tare" value is shown on the bottom line of the display - this is to check whether the tare has been performed or not. After turning off the PidiMet, the tare returns to the default value of 0V.
Taring can also be used to memorize the reference voltage. If you press HOLD during measurement, the current measured value will be used as a reference value and other voltages will be displayed relative to this reference voltage level. This may also display a negative voltage value - but be careful not to confuse this with a negative input voltage, it is only a correction of the displayed data.
Note: Input U2 is physically located between signals OSC1 and OSC2 on the EXT connector. This is for safety reasons. The OSC1 and OSC2 inputs are equipped with 100nF capacitors, which protect the processor in the event of accidental contact between the U2 high-voltage wires and adjacent connector pins. For this reason, the capacitors on the OSC1 and OSC2 inputs should be rated for a sufficiently high voltage (100V).
2 I Current - Current measurement. The current is measured at the "16 I" input. The measurement is performed against ground GND by measuring the voltage across a 1 ohm load resistor. If you want to measure the current inside the device's circuits and not against ground, you must use a separate power supply with isolated ground - either a 5V USB charger or a battery with a 3.3V converter. Caution with USB chargers - some chargers may provide a voltage higher than 5V, or the voltage may be significantly ripple. In this case, it is better to use only 3.3V voltage so that the voltage is stabilized by the internal stabilizer.
The range of the measured current is primarily determined by the permissible power loss on the internal load resistor. The power loss is calculated as the square of the current (calculated with a resistor value of 1 ohm). If you equip the PidiMet with a 0.6W resistor, you can measure currents up to 0.75A (0.75*0.75=0.56W). If you use a 2W resistor, you can measure currents up to 1.4A (1.4*1.4=1.96W). Measure higher currents only for a short time. A heavy load can cause the resistor to overheat and burn out. The theoretical upper limit is the supply voltage - the voltage across the measured resistor must not exceed the supply voltage. Negative current cannot be measured - in this case, the display will show 0A and there is a risk of damage to the PidiMet.
The accuracy of current measurement is approximately 5%. It is affected by inaccuracies of the ADC converter, inaccuracies of the internal voltage reference, and inaccuracies of the reference resistor. The minimum measurable current is 1mA. The absolute measurement error is 3mA.
When measuring small currents, it may be necessary to perform "taring". The ADC converter may exhibit deviations, manifested by the indication of a small current even when the wires are disconnected. Short-circuit the measuring wire "I" to ground "GND". Press the HOLD button - PidiMet will remember the current value of the current, and this value will be subtracted from the measured value. The current "tare" value will be displayed on the bottom row of the display - this is to check whether taring has been performed or not. After turning off PidiMet, taring will return to the default value of 0A.
Taring can also be used to memorize the reference current. If you press HOLD during measurement, the current measured value will be used as a reference value and the next current will be displayed relative to this reference current level. This may also display a negative current value - but be careful not to confuse this with a negative input current, it is only a correction of the displayed data.

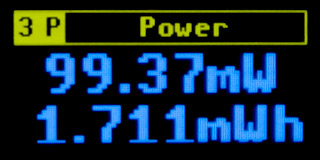
3 P Power Meter - Circuit power consumption measurement. Both inputs are used for power consumption measurement - voltage measurement (inputs "15 U1" or "13 U2") and current measurement (input "16 I"). Power consumption is measured for 500 ms - the current measured voltage and current values are multiplied together, with a time step of approximately 400 µs. This allows the actual power consumption to be measured even when the voltage and current phases are different. However, the measurement can only be used within the ranges given by the voltage and current measurements, as described in modes "1 U" and "2 I" - typically positive voltage up to 3V (U1) or 30V (U2) and current up to 1A (input I).
During measurement, the current power consumption of the measured circuit in watts is displayed on the first row. The accumulated energy in watt-hours is displayed on the second row. The energy increases gradually over time. After each 500 ms measurement cycle, the current data is displayed. No measurement takes place during display operation - after the display ends, the energy consumed during the display time is calculated using the last known value. You can reset the energy consumption data by short pressing the HOLD button.
The selection of input U1 or U2 is not made on this page for power measurement, but on the voltage measurement page "1 U". When measuring power, connect the measured voltage to input U1 or U2 (depending on the required range) and connect the current to input I. Again, note that the current is measured against ground GND. Switch to the "1 U" page, select the U1 or U2 range, and check visually the measured voltage. Switch to the "2 I" page and check the measured current. Finally, switch to the "3 P" page, where the measurement takes place.
The power measurement does not use the taring values selected on pages "1 U" and "2 I". It uses its own taring. If you observe that some power is being measured even though the current or voltage is zero, it is probably necessary to perform taring. Disconnect the voltage measurement cable and short-circuit the current measurement input to ground. Press and hold the HOLD button (for at least 1/2 second). Taring will be performed - the current power consumption value will be recorded and subtracted from the measured data.
The measurement error depends on the conditions specified on pages "1 U" and "2 I". The minimum measurable power is 1uW (input U1) or 10uW (input U2).
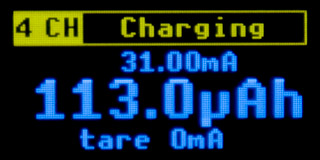
4 CH Charging Meter - Current consumption measurement. When measuring current consumption, the "16 I" input is used similarly to the "2 I" current measurement page, with the same limitation - only positive current can be measured, it is measured against GND ground, and the current can be a maximum of approximately 1A. However, it is necessary to expect a lower current, because prolonged loading can cause overheating and destruction of the 1 ohm reference resistor in the PidiMet.
During measurement, the current is displayed on the first row. The accumulated consumed current in ampere-hours is displayed on the second row. The consumed current gradually increases. After each 500 ms measurement cycle, the current data is displayed. No measurement takes place during display operation - after the display ends, the current consumed during the display time is calculated using the last known value. You can reset the current consumption data by short pressing the HOLD button.
When measuring current, taring is performed together with the current measurement page. Taring may be necessary due to ADC converter deviations. You can perform taring on the "2 I" current measurement page or on this page. Connect the "I" input to ground "GND" and press and hold the HOLD button (for at least 1/2 second). Taring will be performed - the current value of the current will be recorded, which will be subtracted from the measured data. The current "tare" value is shown on the bottom row of the display.
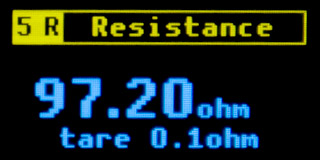
5 R Resistance Meter - Resistor value measurement. Five internal reference resistors with values ranging from 220 to 2M2 are used to measure the resistor value. The measured resistor is connected between pin "20 R/C" and ground GND. A test current is applied to the measured resistor using the reference resistors. The voltage across the resistor is measured using an ADC converter. Resistors in the range of 0.1 ohms to 100 Mohms can be measured, with a resolution of 0.1 ohms. The measurement accuracy is typically 5%. Among other things, it depends on the reference resistors - they should therefore have an accuracy of at least 1%, or even 0.1%. At the ends of the range, below 10 ohms and above 10 Mohms, a deterioration in accuracy of more than 5% must be expected.
The resistor meter can also be used to test LEDs - in the forward direction, the LED flashes at a rate of approximately 2 Hz and the PidiMet shows a lower measured resistance than in the reverse direction. Similarly, the polarity of the diodes can also be tested - the measuring pin "20 R/C" has positive polarity of the test voltage.
The pins otherwise used for programming the processor are also used to control the reference resistors. If you are using a programmer, disconnect it during the measurement of resistors and capacitors, otherwise the measured data will be distorted. Another consequence is that the processor cannot be reprogrammed by the programmer if the page selected is for measuring resistors or capacitors. It is necessary to switch to another page to enable programming.
When measuring small resistance values, it may be necessary to perform "taring". The ADC converter may exhibit deviations, manifested by the indication of low resistance even when the wires are short-circuited. In addition, the resistance of the measuring wires used also has an effect. Short-circuit the "R/C" measuring wire to ground "GND". Press the HOLD button - PidiMet will remember the current resistance value and subtract this value from the measured value. The current "tare" value is shown on the bottom row of the display - this is to check whether taring has been performed or not. After turning off PidiMet, taring returns to the default value of 0.1 ohms.
Taring can also be used to memorize the reference resistance. If you press HOLD during measurement, the current measured value will be used as the reference value and the next value will be displayed relative to this reference resistance level. This means that a negative resistance value can also be displayed.
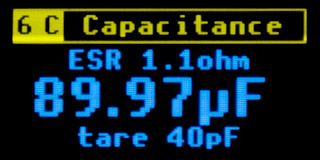
6 C Capacitance Meter - Capacitance and ESR measurement of capacitors. When measuring capacitors, 5 internal reference resistors with values ranging from 220 to 2M2 are used, similar to resistor measurement. The measured capacitor is connected between pin "20 R/C" and ground GND. A test current is applied to the measured capacitor using reference resistors. The voltage across the capacitor is measured using an ADC converter. Both the charging and discharging characteristics of the capacitor are measured. The capacitor value is calculated from the measured curves using logarithmic regression. The measured capacitance value is displayed in the middle row of the display. The ESR value is determined by measuring the step change in voltage after applying the charging current to the capacitor. The ESR value is displayed in the top row of the display.
When measuring capacitors, be careful not to connect a capacitor charged with a higher voltage, which could damage the PidiMet.
Capacitors can be measured in the range from 1 pF (assuming zero calibration) to 4 mF, with a resolution of 1 pF. The measurement accuracy is typically 10%. ESR is measured in the range from 0.1 ohms to 100 ohms. ESR measurement is only indicative and very inaccurate - it is used only for a basic assessment of the quality of the capacitor; the measured value cannot be taken as a reference value.
The pins otherwise used for programming the processor are also used to control the reference resistors. If you are using a programmer, disconnect it during the measurement of resistors and capacitors, otherwise the measured data will be distorted. Another consequence is that the processor cannot be reprogrammed by the programmer if the page selected is for measuring resistors or capacitors. It is necessary to switch to another page to enable programming.
When measuring small capacities, it may be necessary to perform "taring". The ADC converter may exhibit deviations, manifested by the indication of a small capacity even when the wires are disconnected. In addition, the capacity of the measuring wires used also has an effect. Disconnect the "R/C" measuring wire. Press the HOLD button - PidiMet will remember the current capacity value and subtract this value from the measured value. The current "tare" value is shown on the bottom row of the display - this is to check whether taring has been performed or not. After turning off the PidiMet, taring returns to the default value of 40 pF. The ESR value does not have taring.
Taring can also be used to memorize the reference capacity. If you press HOLD during measurement, the current measured value will be used as the reference value and the next value will be displayed relative to this reference capacity level. This means that a negative capacity value can also be displayed.
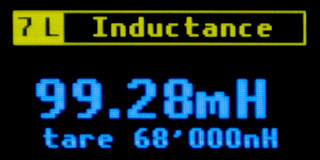
7 L Inductance Meter - Measuring coil inductance. An oscillator with an LM311D comparator is used to measure the coils. The coil being measured is connected between pin "18 L" and ground "GND". The oscillator oscillates at a frequency given by a parallel reference capacitor of 1nF and a series reference coil of 68uH. The processor measures the generated frequency and calculates the inductance of the coil from it.
The lowest measurable inductance is 100nH (assuming zero tare calibration). The resolution of the data is 10nH. The relative error is approximately 10% and depends primarily on the accuracy of the 1nF reference capacitor. The absolute error is 50nH. The upper limit of measurable inductance is unknown - during testing, the oscillator oscillated reliably even at an inductance of 20H.
The 68uH reference coil is connected in series with the measured coil and serves to limit the upper frequency of the oscillator so that the oscillator operates in a stable range. When measuring, it is necessary to subtract the inductance of the reference coil from the measured data. The value of the reference coil does not have to be accurate, but it may be necessary to perform zero calibration more often than with other measurements when measuring coils.
When taring, connect the "L" measuring wire to the "GND" ground and press the HOLD button. PidiMet will remember the current inductance value and subtract this value from the measured value. The current "tare" value will be displayed on the bottom line of the display - this is to check whether taring has been performed or not. After turning off the PidiMet, taring will return to the default value of 68 uH.
Taring can also be used to memorize reference inductance. If you press HOLD during measurement, the current measured value will be used as a reference value and the next value will be displayed relative to this reference inductance level. This means that negative inductance values can also be displayed.
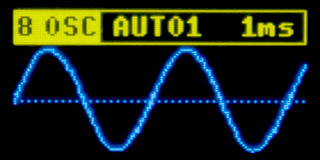
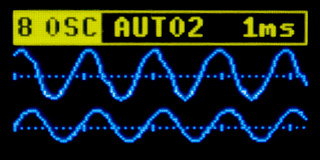
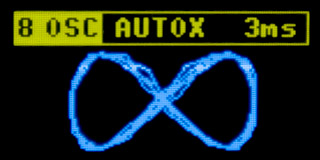
8 OSC Oscilloscope - The "8 OSC" page is a simple oscilloscope. Despite its simplicity, it can be very useful for amateur practice. You can use 1-channel, 2-channel, and XY display modes. The input signal can be DC (positive only) or AC. In 1-channel mode, the input signal is fed either to input "10 IN1" or to input "12 OSC1". The IN1 input is a DC input. The input voltage must be in the range of 0 to VDD. The display does not show the specific voltage value, but the voltage range relative to the supply voltage. If the input voltage is VDD, it is displayed at the top of the curve. The OSC1 input is connected to the IN1 input via a 100nF capacitor. Using the artificial center of the supply voltage from two 470K resistors, it is possible to display an AC voltage signal in the range of -VDD/2 to +VDD/2. The same applies to the second channel of the oscilloscope - either the "11 IN2" input can be used for a positive DC signal, or the "14 OSC2" input for an AC signal. The OSC1 and OSC2 inputs are the only cases where a negative voltage (within the permitted range) can be applied to the PidiMet.
The oscilloscope input loads the measured circuit with an impedance of 220 kohm. For DC inputs IN1 and IN2, it is necessary to take into account that the input circuit contains a voltage divider to create an artificial center. Therefore, when unloaded, the voltage at inputs IN1 and IN2 will be equal to half the supply voltage. The measured circuit should have a sufficiently low impedance so that it is not affected by the voltage divider.
The FAST and SLOW buttons switch the oscilloscope time base and oscilloscope mode (1 channel, 2 channels, and XY mode). A dashed line is displayed in the middle of the channel on the display, representing the zero point of the AC signal or half the voltage of the DC signal. There are 5 marks on the zero axis, indicating the time scale interval. The time scale can be switched between 10us, 30us, 100us, 300us, 1ms, 3ms, 10ms, 30ms, and 100ms. At a scale of 10 µs, the total displayed time is 42.7 µs. At a scale of 100 ms, the total displayed time is 427 ms. In the fastest 10us mode, the signal is sampled at a frequency of 3Msps. In two-channel mode and XY mode, the upper sampling rate is limited, and therefore in these modes the first two fastest modes have times of 20us and 40us (instead of 10us and 30us).
Unlike analog oscilloscopes, switching speeds is also important in XY mode. The selected speed determines both the signal sampling rate and the time during which the signal is sampled. If the speed is too high, only a short section of the curve will be displayed. If the speed is too low, many curves will be displayed on top of each other. At very low speeds, only segmented lines are displayed instead of a curve.
In XY mode, the first channel IN1/OSC1 controls the horizontal axis, while the second channel IN2/OSC2 controls the vertical axis. The image is stretched across the entire display area. If both input signals are in the range of 0 to VDD, a curve measuring 128x48 pixels is displayed (i.e., stretched sideways).
A short press of the HOLD button stops the display from redrawing. This is particularly useful in the case of an unstable signal, making it easier to examine the displayed waveform. Holding down the HOLD button for at least 1/2 second switches to AUTO mode, i.e., automatic synchronization of the start of the curve. When automatic synchronization is turned off, only the most necessary short section of data is recorded and immediately displayed. This FREE mode is used for quick redrawing of the display. When automatic mode is turned on, a section of the signal 2x to 4x longer than the display is loaded. After the data is recorded, the recorded curve is searched. The steepest point is searched for (through a longer interval - integration with "prefix sum" is used), with preference given to the curve passing through the center (zero).
Note: Input U2 is physically located between signals OSC1 and OSC2 on the EXT connector. This is for safety reasons. The OSC1 and OSC2 inputs are equipped with 100nF capacitors, which protect the processor in the event of accidental contact between the U2 high-voltage wires and adjacent connector pins. For this reason, the capacitors on the OSC1 and OSC2 inputs should be rated for a sufficiently high voltage (100V).
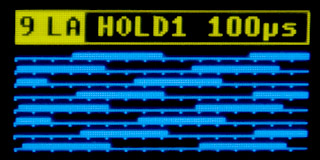
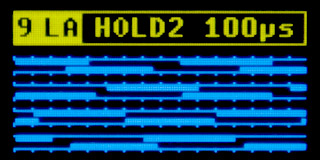
9 LA Logic Analyzer - The logic analyzer allows you to display digital signals in one or two input channels. In single-channel mode, the input signal is fed to input "10 IN1". In dual-channel mode, the second signal is fed to input "11 IN2". In single-channel mode, the signal is displayed divided into 8 lines. There are 16 marks on each line. Each mark represents one time interval. The total duration of the displayed signal corresponds to 128 marks.
The FAST and SLOW buttons switch between one or two channels and between time bases of 1us, 10us, 100us, 1ms, and 10ms, representing the length of one segment (1 time mark). In 1us mode, the total time of the displayed interval is 128us. In 10ms mode, the entire time interval representing 1.28 seconds is displayed. In two-channel mode, the channels are displayed in pairs of timelines. Each displayed channel is thus only 64 time stamps long. This means that at a speed of 1us, the displayed interval is 64us, and at a speed of 10ms, the displayed interval is 640ms. In the fastest mode, the sampling rate is 8 MHz.
A short press of the HOLD button stops the display from redrawing, allowing you to view the signals. A long press of the HOLD button (for at least 1/2 second) activates AUTO mode. In this state, the analyzer waits for a change in the signal state in channel 1 (also valid for two-channel mode). When an edge arrives, the signal begins to be recorded. When the buffer is full, recording stops and the analyzer enters HOLD mode, displaying the recorded signal. Pressing the HOLD button shortly returns to FREE mode, where the signal is constantly redrawn, or pressing it long activates a new start with AUTO.
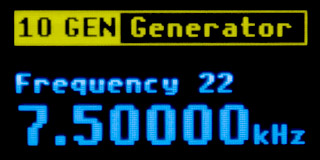
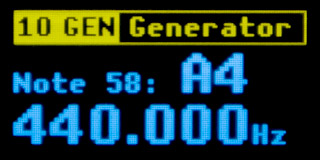
10 GEN Frequency Generator - The frequency generator generates a digital signal at the "9 GEN" output. The SLOW and FAST buttons are used to switch frequencies. The HOLD button is used to switch between frequency sets. The first set, labeled "Frequency", is a set of frequencies with a decimal base: 1 Hz, 2 Hz, 3 Hz, ... 12 MHz, 16 MHz, 24 MHz, 48 MHz. The highest frequency of 48 MHz is obtained by directly connecting the system clock to the output pin.
Please note possible instability - in some cases, the prototype exhibited instability at higher frequencies, manifested by the processor freezing. With a 3.3V power supply, there was sometimes a problem with the 48 MHz frequency, while with a 5V power supply, the 24 MHz and 48 MHz frequencies sometimes caused problems. The reason could be an incorrect PCB design, where higher frequencies can be induced into the free pins of the processor - it seemed that the oscillation of the crystal oscillator was being disrupted. If you are skilled at designing PCBs, I recommend using your own design.
The second frequency set, labeled "Note", generates frequencies in musical tones. Tones are generated in a range of 10 octaves, from C0 to B9. This corresponds to a frequency range of 16.3516 Hz to 15804.3 Hz.
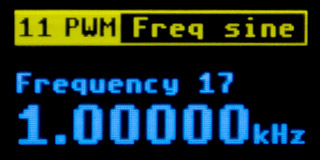
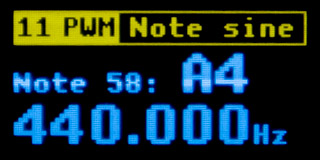
11 PWM Function Generator - The function generator generates analog signals at the "8 PWM" output. The SLOW and FAST buttons switch the frequency. The HOLD button switches both the frequency set and the signal shape - sine, triangle, and sawtooth. The first set, labeled "Frequency", is a set of frequencies with a decimal base: 1 Hz, 2 Hz, 3 Hz, ... 10 kHz, 15 kHz, 20 kHz, 30 kHz. The second frequency set, labeled "Note", generates frequencies in musical tones. Tones are generated in a range of 10 octaves, from C0 to B9. This corresponds to a frequency range of 16.3516 Hz to 15804.3 Hz.
PWM modulation is used to generate the signal. The basic carrier frequency of PWM is 375 kHz. The PWM cycle is 128 cycles of the 48 MHz system clock. The PWM output passes through an RC filter consisting of a 470 ohm resistor and a 22nF capacitor. The RC filter filters out the carrier frequency of the PWM modulation. This is a simple low-pass filter, so its imperfection must be taken into account - the carrier frequency still appears in the generated signal, with an amplitude of about 5%, and at generated frequencies of 10 kHz and above, amplitude attenuation already occurs - the 30 kHz frequency is already attenuated to about 50%. The generated signal can only be used for rough testing; it is definitely not suitable for testing the quality of an audio transmission system.
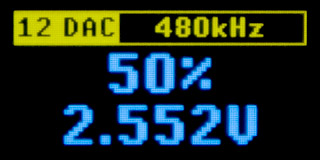
12 DAC Voltage Regulator - The voltage regulator is used to control the output voltage. The regulated voltage output is connected to pin "8 PWM". The SLOW and FAST buttons are used to select the output voltage level in the range of 0 to 100%. The output voltage ranges from 0V to the maximum supply voltage VDD. PWM modulation is used to generate the output voltage, with carrier frequency filtering via an RC filter.
The HOLD button switches the carrier frequency. You can select a carrier frequency of 480kHz, 1kHz, or 50Hz. At a carrier frequency of 480kHz, the carrier frequency is almost completely filtered out - the carrier frequency manifests itself in the voltage only as slight noise. It can therefore be used where a continuously adjustable analog voltage is required. The 1kHz carrier frequency is suitable for motor control, for example. The carrier frequency is no longer suppressed by the RC filter; the output has a rectangular shape with adjustable width. With motors, however, be careful of reverse surges from the coils to avoid damaging the processor.
The third option, 50 Hz, is suitable, for example, for controlling dimmers or regulating LED lighting. Another possible use is testing RC model servos. At a frequency of 50 Hz, the signal period is 20 ms. You can obtain the neutral position of the servo (1.5 ms) by setting the DAC to 7 or 8%. The first end position of the servo (0.5 to 1 ms) can be set by selecting 2 to 5%. The second end position of the servo (2 to 2.5 ms) can be obtained by setting the DAC to 10 to 13%.
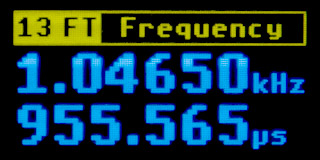
13 FT Frequency Meter - Frequency and period measurement. This mode is used to measure the frequency and period of a digital signal fed to the "10 IN1" input. Frequencies up to 24 MHz can be measured. The lower frequency limit is not specified - it depends on the measurement time. PidiMet needs to see two signal edges to measure slow frequencies, which means that with very slow signals, the measured value may only be displayed after a while.
The measured frequency is displayed on the first row of the display, and the signal period - calculated as the reciprocal of the frequency - is displayed on the second row. The accuracy of the frequency measurement depends primarily on the frequency of the crystal used. The measured data is displayed to 6 valid digits. Common crystals have an accuracy of approximately 50 ppm (which is 0.005%). This can result in an error in the last 2 digits of the measured data.
If the crystal does not work (an error message appears at startup) or if you do not install the crystal at all, the internal 48 MHz HSI oscillator is used, which has a frequency accuracy of around 1%. In this case, you must expect significantly poorer accuracy of the measured data.
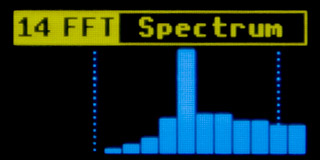
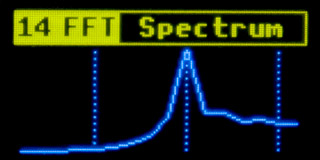
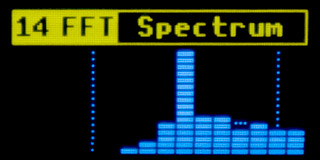
14 FFT Spectrum Analyzer - The spectrum analyzer is used to display the spectrum of the analog signal fed to input "10 IN1". The spectrum is displayed in 16 bands with logarithmic frequency distribution in the range of 16 Hz to 16 kHz. Second-order IIR biquad filters with Q=10 are used for signal analysis. The ADC sampling frequency is 44100 Hz. The display refresh rate is 22 FPS. The displayed graphs use attack and decay filtering (fast rise and slow fall).
The FAST and SLOW buttons switch between display modes - "smooth bars", "curve line" and "peak bars". In "smooth bars" mode, 16 columns with smooth height are displayed. In "curve line" mode, a curve is displayed. In "peak bars" mode, columns divided into segments are displayed. This last mode also supports "peaks" - indications of the maximum position reached by the column.
The HOLD button can be used to temporarily pause changes in the graph.
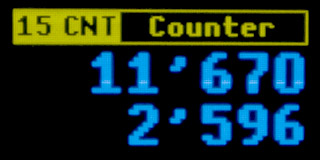
15 CNT Counter - The counter counts the rising edges of the digital signal fed to the "10 IN1" input. Signal pulses with frequencies up to 24 MHz can be counted. Pulse counting takes place on the top row of the display. Press the SLOW button to record the current counter status in the bottom row. The FAST button temporarily pauses the update of the data in the top row to make it easier to read. Meanwhile, the counter continues to count. The display update is resumed by pressing the FAST button again. The HOLD button resets the counter and the displayed data.
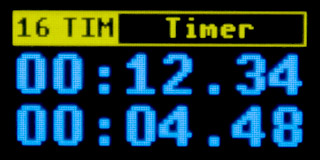
16 TIM Timer - The timer measures elapsed time. It is not connected to any external signal. It is the only process that runs in PidiMet throughout the entire power-on period. Its time corresponds to the time elapsed since power-on. Press the SLOW button to record the current status of the time counter in the bottom row. The FAST button temporarily pauses the update of the data in the upper row to make it easier to read. Meanwhile, the time counter continues to count. The display update is resumed by pressing the FAST button again. The HOLD button resets both the time counter and the displayed data.
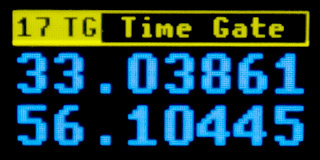
17 TG Time Gate - The time gate measures the time keyed by the level of the input digital signal on pin "10 IN1". The first row counts the time when the input signal is at the HIGH level. The second row counts the time when the input signal is at the LOW level. The input signal is sampled at a frequency of 100kHz, with intervals of 10us. The timers overflow after 11 hours and 55 minutes. The HOLD button pauses the display update - but the counters continue to run in the meantime. The SLOW button resets the counters and the displayed values.
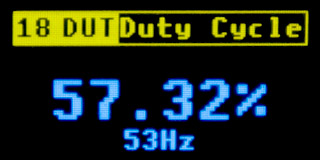
18 DUT Duty Cycle - Signal duty cycle measurement. This function measures the ratio of the pulse width of the HIGH level of the digital signal fed to the "10 IN1" input to the signal period. The first row shows the signal duty cycle in percent, the second row shows the approximate signal frequency. Signals with frequencies from 4Hz to 400kHz can be measured. However, for frequencies around 400kHz, it is necessary to take into account that these frequencies are at the limit of this measurement mode's capabilities. It may happen that at high signal frequencies, the interrupt handler becomes overloaded, causing the program to be unable to service the main program loop. In this case, the watchdog will reset the PidiMet after 3 seconds of inactivity. It is also necessary to take into account that in the case of high frequencies, or if the signal source is "soft" (has high output impedance), signal edge distortion may occur, which will result in inaccurate measurements.
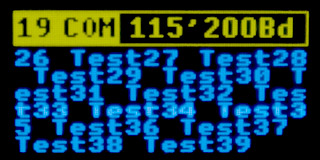
19 COM UART Communication - Communication via UART. The "COM" page is used to test communication via the UART (or USART) serial port. Transmitted data is fed to pin "6 TX/SCL" - the receiving pin "RX" of the opposite device is connected to this pin. Data is received on pin "5 RX/SDA" - the transmit pin "TX" of the opposite device is connected to this pin. The signal levels must correspond to the selected supply voltage (3.3V or 5V). Do not connect an RS232 interface that uses 12V directly to the pins, as this could damage the PidiMet processor. In the simplest case, you can interconnect pins "6 TX" and "5 RX" - this allows you to monitor your own data transmitted to the transmission line.
During the test, test samples containing the text "Test" and a number that is incremented sequentially are sent to the TX transmit pin. The samples are sent at 1-second intervals. The data received from the RX receive pin is displayed on the screen. The program interprets the control codes CR (reset the display position to the beginning of the current row) and LF (move to the beginning of the next row). Other data is displayed as valid characters. Characters with a code of 128 and above are displayed as inverted characters.
Communication uses the UART protocol with default settings - word length 8 bits, no parity, 1 stop bit. Only the transmission speed can be selected using the FAST and SLOW buttons in the range from 900 baud to 3 Mbaud. The output to the display is not in real time - if a large amount of data arrives at the receiver, the program processes it all and displays the final content on the screen. This mode can also be used as a terminal to display serial data from devices with high transmission speeds.
A short press of the HOLD button stops the display from updating to make it easier to read the data on the display. Communication continues during this time - when the displaying is restored by pressing the HOLD button again, the new current display content is shown. Pressing and holding the HOLD button (for at least 1/2 second) clears the display content and resets the transmitted data counter.
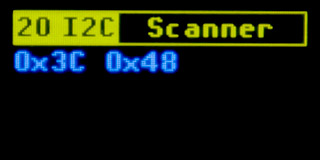
20 I2C Scanner - I2C address scanner. The I2C scanner is used to detect the addresses of devices connected to the I2C bus. The SDA signal of the I2C bus is connected to pin "5 RX/SDA", and the SCL signal of the I2C bus is connected to pin "6 TX/SCL". Communication via the I2C bus takes place in open collector mode, with a pull-up resistor of approximately 45 kOhm. The voltage corresponds to the selected supply voltage - be careful not to damage devices that only support 3.3V by connecting them to a 5V bus.
Detection is performed by monitoring the ACK signal confirmation during a connection request. If you see a large number of devices detected (addresses 0x01, 0x02, etc.), this indicates a short circuit of the SDA signal to ground.
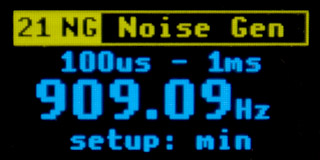
21 NG Noise Generator - The noise generator generates a digital signal with random LOW and HIGH pulse widths on the "7 GEN" output pin. The SLOW and FAST buttons can be used to select the range of generated pulse widths from 2us to 50ms. The HOLD button can be used to select whether the SLOW/FAST buttons set the upper or lower limit of the generated pulse range. If the minimum value is higher than the maximum, the program will swap the values. The first row of the display shows the currently set limits of the generated pulses. The middle row shows the corresponding center frequency as it would be detected by a frequency meter with a long measurement time. The bottom row shows the setting mode, whether the minimum (first limit) or maximum (second limit) of the generated pulses is being set. It is not possible to set both limits to 2us - the program would not be able to generate pulses fast enough.
22 NA Noise Analog - Analog noise generator. The analog noise generator generates an analog signal on the "8 PWM" output pin, using PWM modulation with a modulation frequency of 240 kHz. This is not real noise, but a voltage with a randomly varying value, suitable for testing the response of the device to a variable input. A pseudo-random sequence of levels is generated in a buffer of 2048 entries using Perlin noise with 11 octaves.
The SLOW and FAST keys can be used to select the playback speed of the sample buffer, thereby selecting both the lowest voltage oscillation period and the proportion of the highest harmonic components. The playback speed is determined by the time of one buffer playback in the range of 17 seconds to 17 ms.
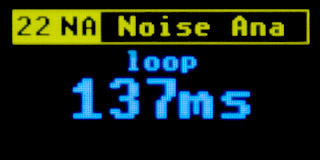
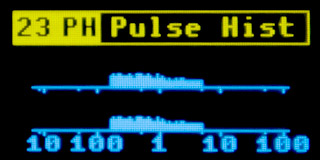
23 PH Pulse Histogram - The pulse histogram is similar to a spectrum analyzer for digital signals. The input digital signal is fed to the "10 IN1" input. Two graphs (histograms) are displayed on the screen. The upper histogram represents the number of pulses with a HIGH level. The lower histogram represents the number of pulses with a LOW level. The horizontal axis represents pulse lengths on a logarithmic scale. The axis has marks representing pulse lengths of 10us, 100us, 1ms, 10ms, and 100ms. Between the marks, there are also shorter marks representing pulse lengths of 5us, 50us, 500us, 5ms, and 50ms. The HOLD button resets the histograms.
Pulse lengths are measured with a minimum resolution of 2 µs. For this reason, values of 10 µs and below may not be accurate, as pulses may also appear at adjacent positions. The longest measurable length is 131 ms. The program does not check for pulse length overflow - in such a case, an undetectable long pulse may appear anywhere randomly on the timeline.
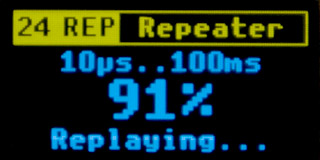
24 REP Repeater - The repeater is used to record a section of a digital signal and repeat it. The recorded input digital signal is fed to pin "10 IN1". The reproduced output signal is on pin "7 GEN". A buffer with a length of 2048 samples is used for recording. One sample represents the length of the HIGH or LOW pulse level in the range of 10us to 100ms. For example, if you record a signal with a frequency of 1 kHz, the recording will take approximately 1 second and each sample will contain a pulse length of 500us. Recording a signal with a frequency of 50 Hz can take up to 20 seconds.
Press the FAST button to start recording. The input signal must have LOW and HIGH pulses in the range of 10us to 100ms - this information is displayed on the first line of the display. The program does not check for pulse length overflow. If a pulse length overflows, it may have a random length during reproduction (as a modulo operation with a maximum interval of 131 ms). Recording begins when the first signal edge arrives. The program records the initial steady state of the input and later sets this state as the default state for the output as well.
The time between pressing the FAST button and the first edge of the signal is stored as the length of the first pulse, and this length is also used during playback. Again, no overflow check is performed - this means that signal playback may start with a delay of up to 100 ms after pressing the play button. During signal recording, the buffer fill counter is incremented in percent on the display. Recording ends either when the buffer is full or when any of the buttons is pressed.
Press the SLOW button to start playback of the recorded signal. The middle row of the display shows the percentage of the recording that has been played back. Playback ends either when all data has been played back or when any button is pressed. Before playback, the output is set to the same LOW or HIGH signal level as was present at the input at the start of recording.
The HOLD button starts repeated playback of the recorded signal. The function is similar to single playback of the recording, with the difference that playback is automatically repeated after a delay of 50 to 150 ms.
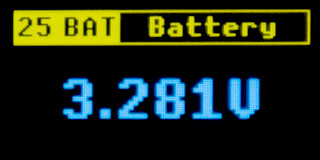
25 BAT Battery - The BAT page displays the current value of the PidiMet power supply voltage. The accuracy of the voltage measurement depends primarily on the accuracy of the processor's internal reference, which is typically around 1%. The battery value is also displayed on the start screen when the PidiMet is powered on - to check what voltage the PidiMet is powered by, as this also determines, for example, what voltage levels of the tested device can be worked with.
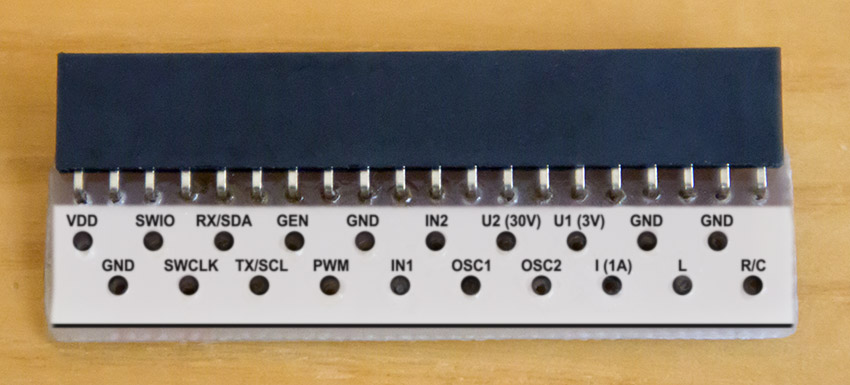
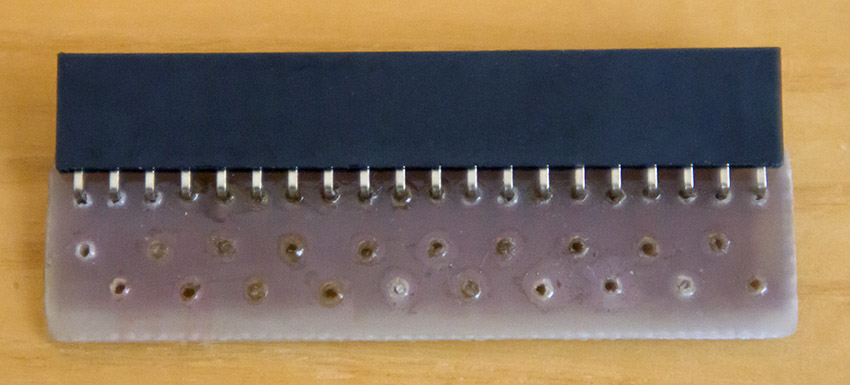
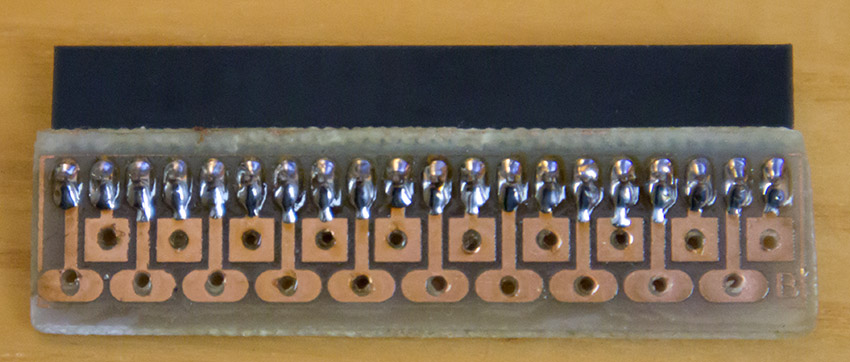
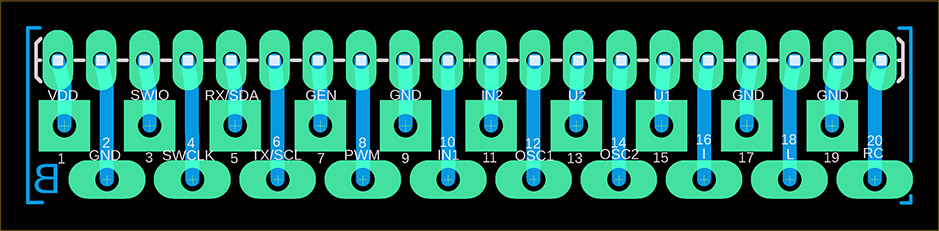
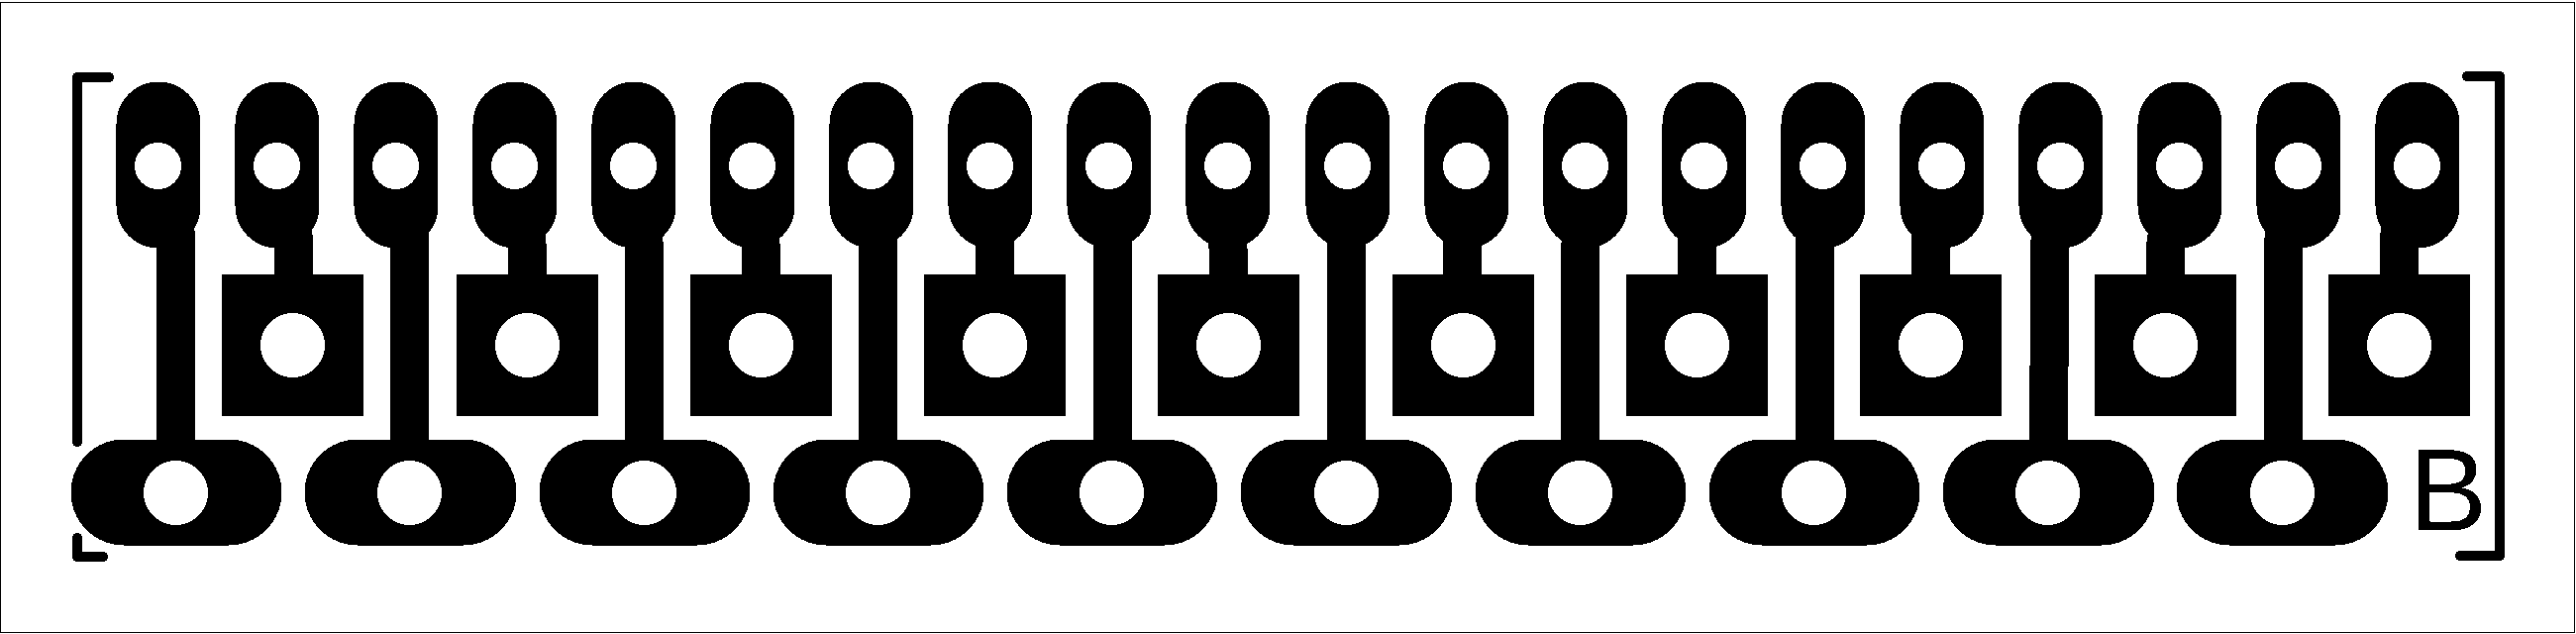
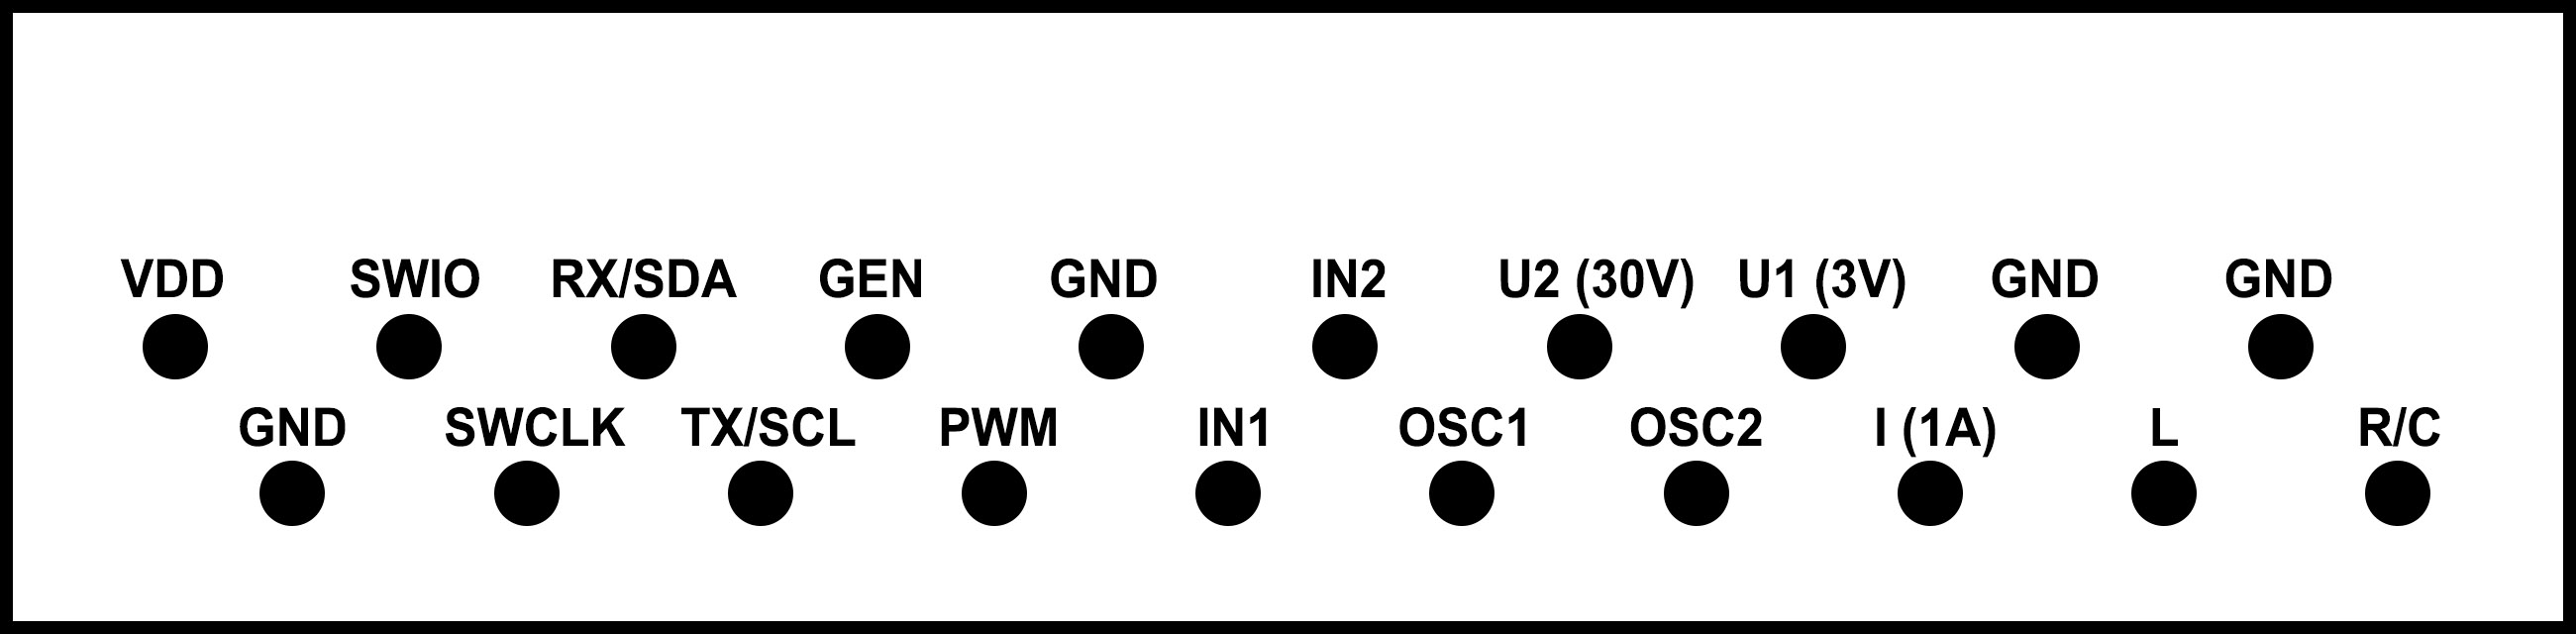
All necessary PidiMet measurement signals are connected to an external connector - a 20-pin pin header. Measurement cables are connected by replacing the adapter for the external connector. Description of connector pins:
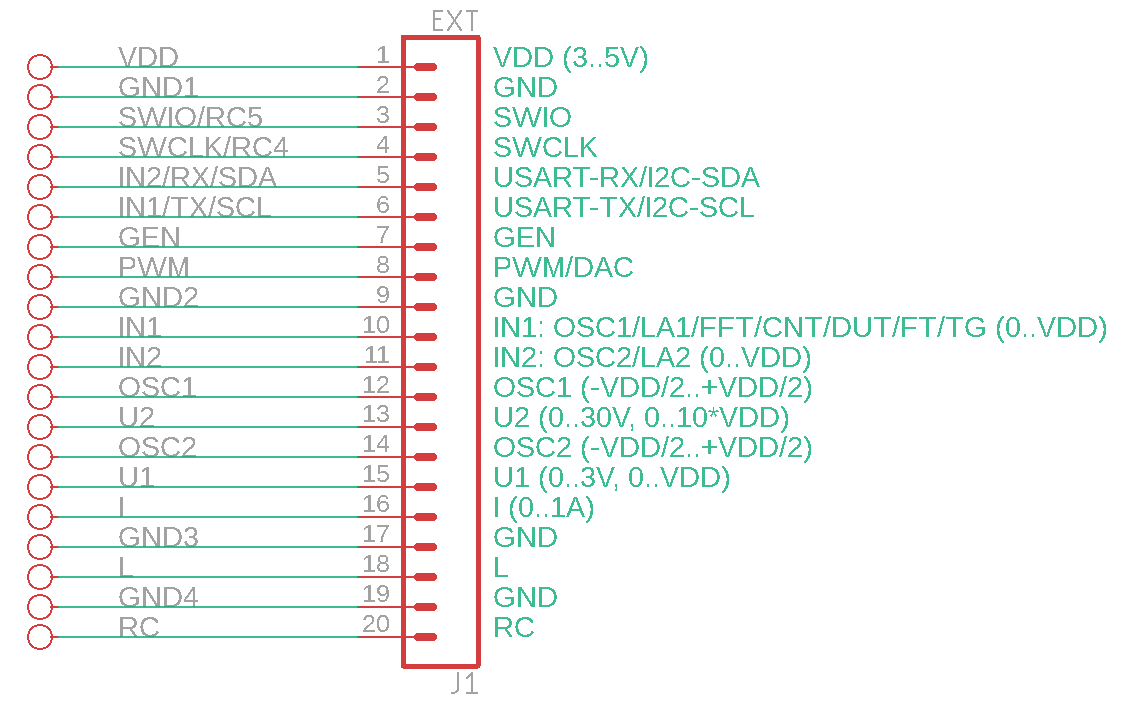
1 VDD ... PidiMet power supply voltage. When connecting PidiMet to USB power, voltage can also be drawn from this pin for the tested device. The voltage level can be selected using the "USB Power" jumper, either 3.3V or 5V. If USB power is not used, PidiMet can be powered via this pin from an external source or directly from the tested device.
2 GND ... Ground.
3 SWIO ... Data programming input. Used to program the processor with a programmer. Internally, this signal is also used to control resistor R5 when measuring resistors and capacitors. For this reason, the processor cannot be programmed when the page for measuring resistors or capacitors is selected.
4 SWCLK ... Clock programming input. Can be used to program the processor in 2-wire mode. However, it is not necessary to use it, as the processor also allows programming in 1-wire mode. Internally, this signal is also used to control resistor R4 when measuring resistors and capacitors. For this reason, the processor cannot be programmed when the page for measuring resistors or capacitors is selected.
5 RX/SDA ... USART RX serial data input for page "19 COM", I2C SDA data line for page "20 I2C".
6 TX/SCL ... USART TX serial data output for page "19 COM", I2C SCL clock line for page "20 I2C".
7 GEN ... Digital signal output for pages "10 GEN", "21 NG", and "24 REP".
8 PWM/DAC ... Analog signal output (via RC filter) for pages "11 PWM", "12 DAC", and "22 NA".
9 GND ... Ground.
10 IN1 ... Digital and analog signal inputs for pages "8 OSC" channel 1 DC, "9 LA" channel 1, "13 FT", "14 FFT", "15 CNT", "17 TG", "18 DUT", "23 PH" and "24 REP".
11 IN2 ... Digital and analog signal inputs for pages "8 OSC" channel 2 DC and "9 LA" channel 2.
12 OSC1 ... Analog signal input for page "8 OSC" channel 1 AC.
13 U2 ... Voltage measurement input in the range of 0..30V (or 0..11*VDD) for page "1 U". The input has an impedance of 2.2 Mohms. This pin is intentionally located between pins "12 OSC1" and "14 OSC2" because these pins are separated by 100nF capacitors and can thus serve as protection for the processor against high voltage breakdown in the event of unwanted contact between the wire and the adjacent pin.
14 OSC2 ... Analog signal input for page "8 OSC" channel 2 AC.
15 U1 ... Voltage measurement input in the range of 0..3V (or 0..VDD) for page "1 U". The input has an input impedance of 220 kOhm.
16 I ... Current measurement input for page "2 I". It is recommended to use pin "17 GND" as the second pole of the current measurement, which is connected by a reinforced conductor to a 1 ohm reference resistor.
17 GND ... Ground.
18 L ... Coil measurements for page "7 L".
19 GND ... Ground.
20 R/C ... Measuring resistors and capacitors for pages "5 R" and "6 C".
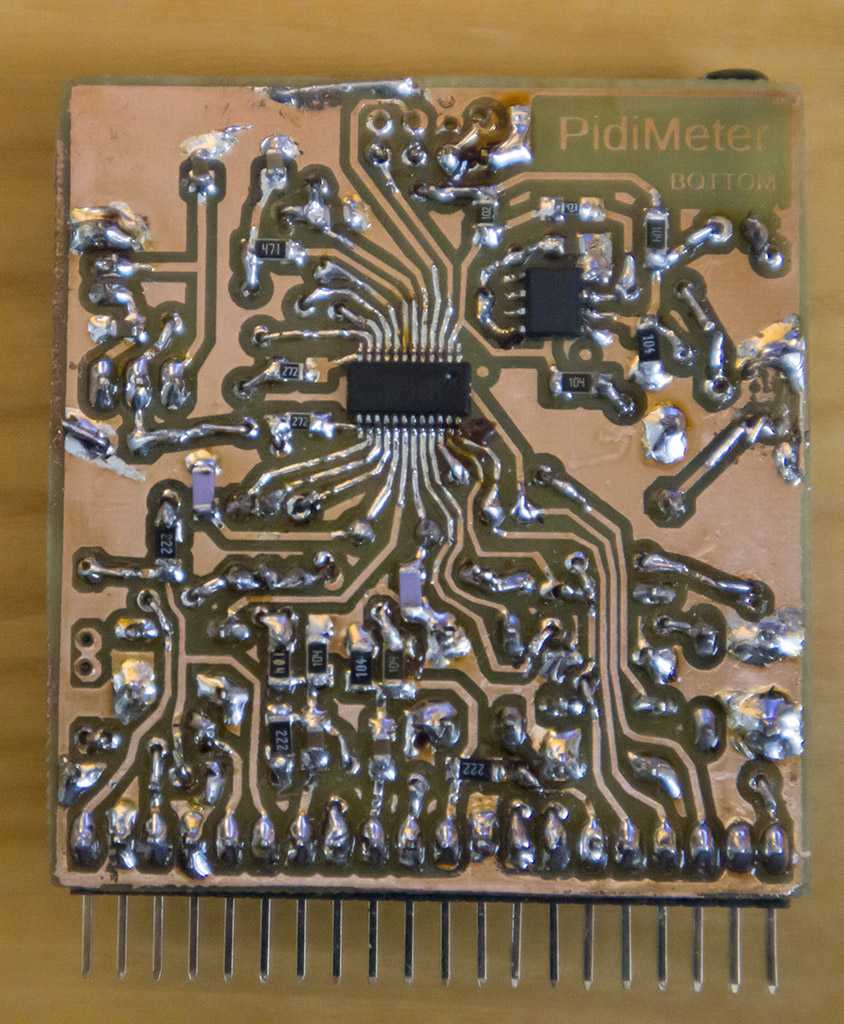
The PidiMet multimeter is controlled by an cheap Chinese processor CH32V006E8R6.
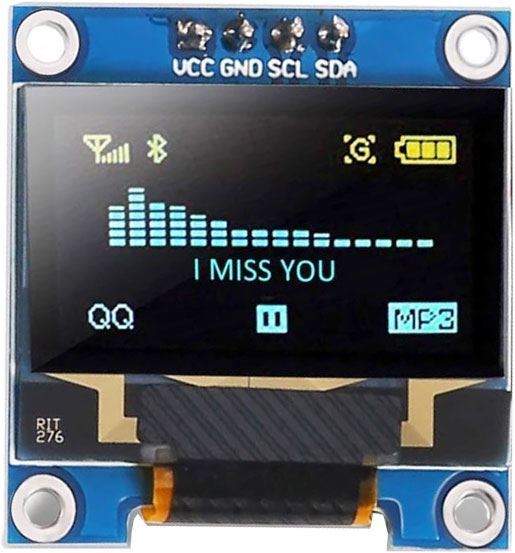
The display used is a 0.96" OLED I2C display with an SSD1306 controller and a resolution of 128x64, powered by 3 to 5V. I recommend using a two-color display with 16 yellow lines and 48 blue lines, for which the software was designed. You can find the display here, for example: https://www.hadex.cz/m508c-displej-oled-096-128x64-znaku-iici2c-4piny-modrozluty/.
The processor is controlled by a 24 MHz crystal. If you do not require precise timing functions (frequency generator, frequency meter), you can omit the crystal and the corresponding capacitors C2 and C3. In this case, the processor will use the internal HSI clock source, which has a frequency accuracy of around 1%.
An oscillator with an LM311D comparator is used to measure the coils. A reference capacitor C1 with a capacity of 1nF is connected in parallel to the measured inductance. Use a foil capacitor, which is more stable and accurate than a ceramic capacitor. The accuracy of the coil measurement depends on the accuracy of the reference capacitor - therefore, use the most accurate capacitor possible, at least 5%. An auxiliary coil L1 68uH is connected in series to the measured coil. This coil serves to limit the upper frequency limit of the oscillator. Its value is subtracted from the measured value. The value of the auxiliary coil does not have to be accurate - its value is corrected during measurement taring (zeroing). If you do not require coil measurement, you can omit the entire circuit marked "Optional L-oscillator".
Resistors R1 to R5 are used to measure resistors and capacitors. Use accurate resistors if possible, with an accuracy of 0.1% or at least 1%. The accuracy of the measurement of resistors and capacitors depends on their accuracy.
Resistor R6 has a value of 1 ohm and is used to measure current. It should have the highest possible accuracy, 0.1% or at least 1%, because the accuracy of the current measurement depends on its accuracy. In addition, it should also be dimensioned for sufficient power loss. If you use a 0.6W resistor, it will be possible to measure currents up to 0.75A. With a 2W resistor, it will be possible to measure currents of 1A.
Resistors R7 and R8 are part of the voltage divider when measuring voltages up to 30V via pin U2. Again, use the most accurate ones possible, as their accuracy determines the accuracy of voltage measurements in the 30V range.
The OSC1 and OSC2 inputs are equipped with 100nF capacitors, allowing AC voltage to be displayed on an oscilloscope. In addition, they have an auxiliary function - they protect the processor from high voltage if the U2 input conductor accidentally comes into contact with adjacent connector pins. Therefore, these capacitors should be rated for a higher voltage, e.g., 100V.
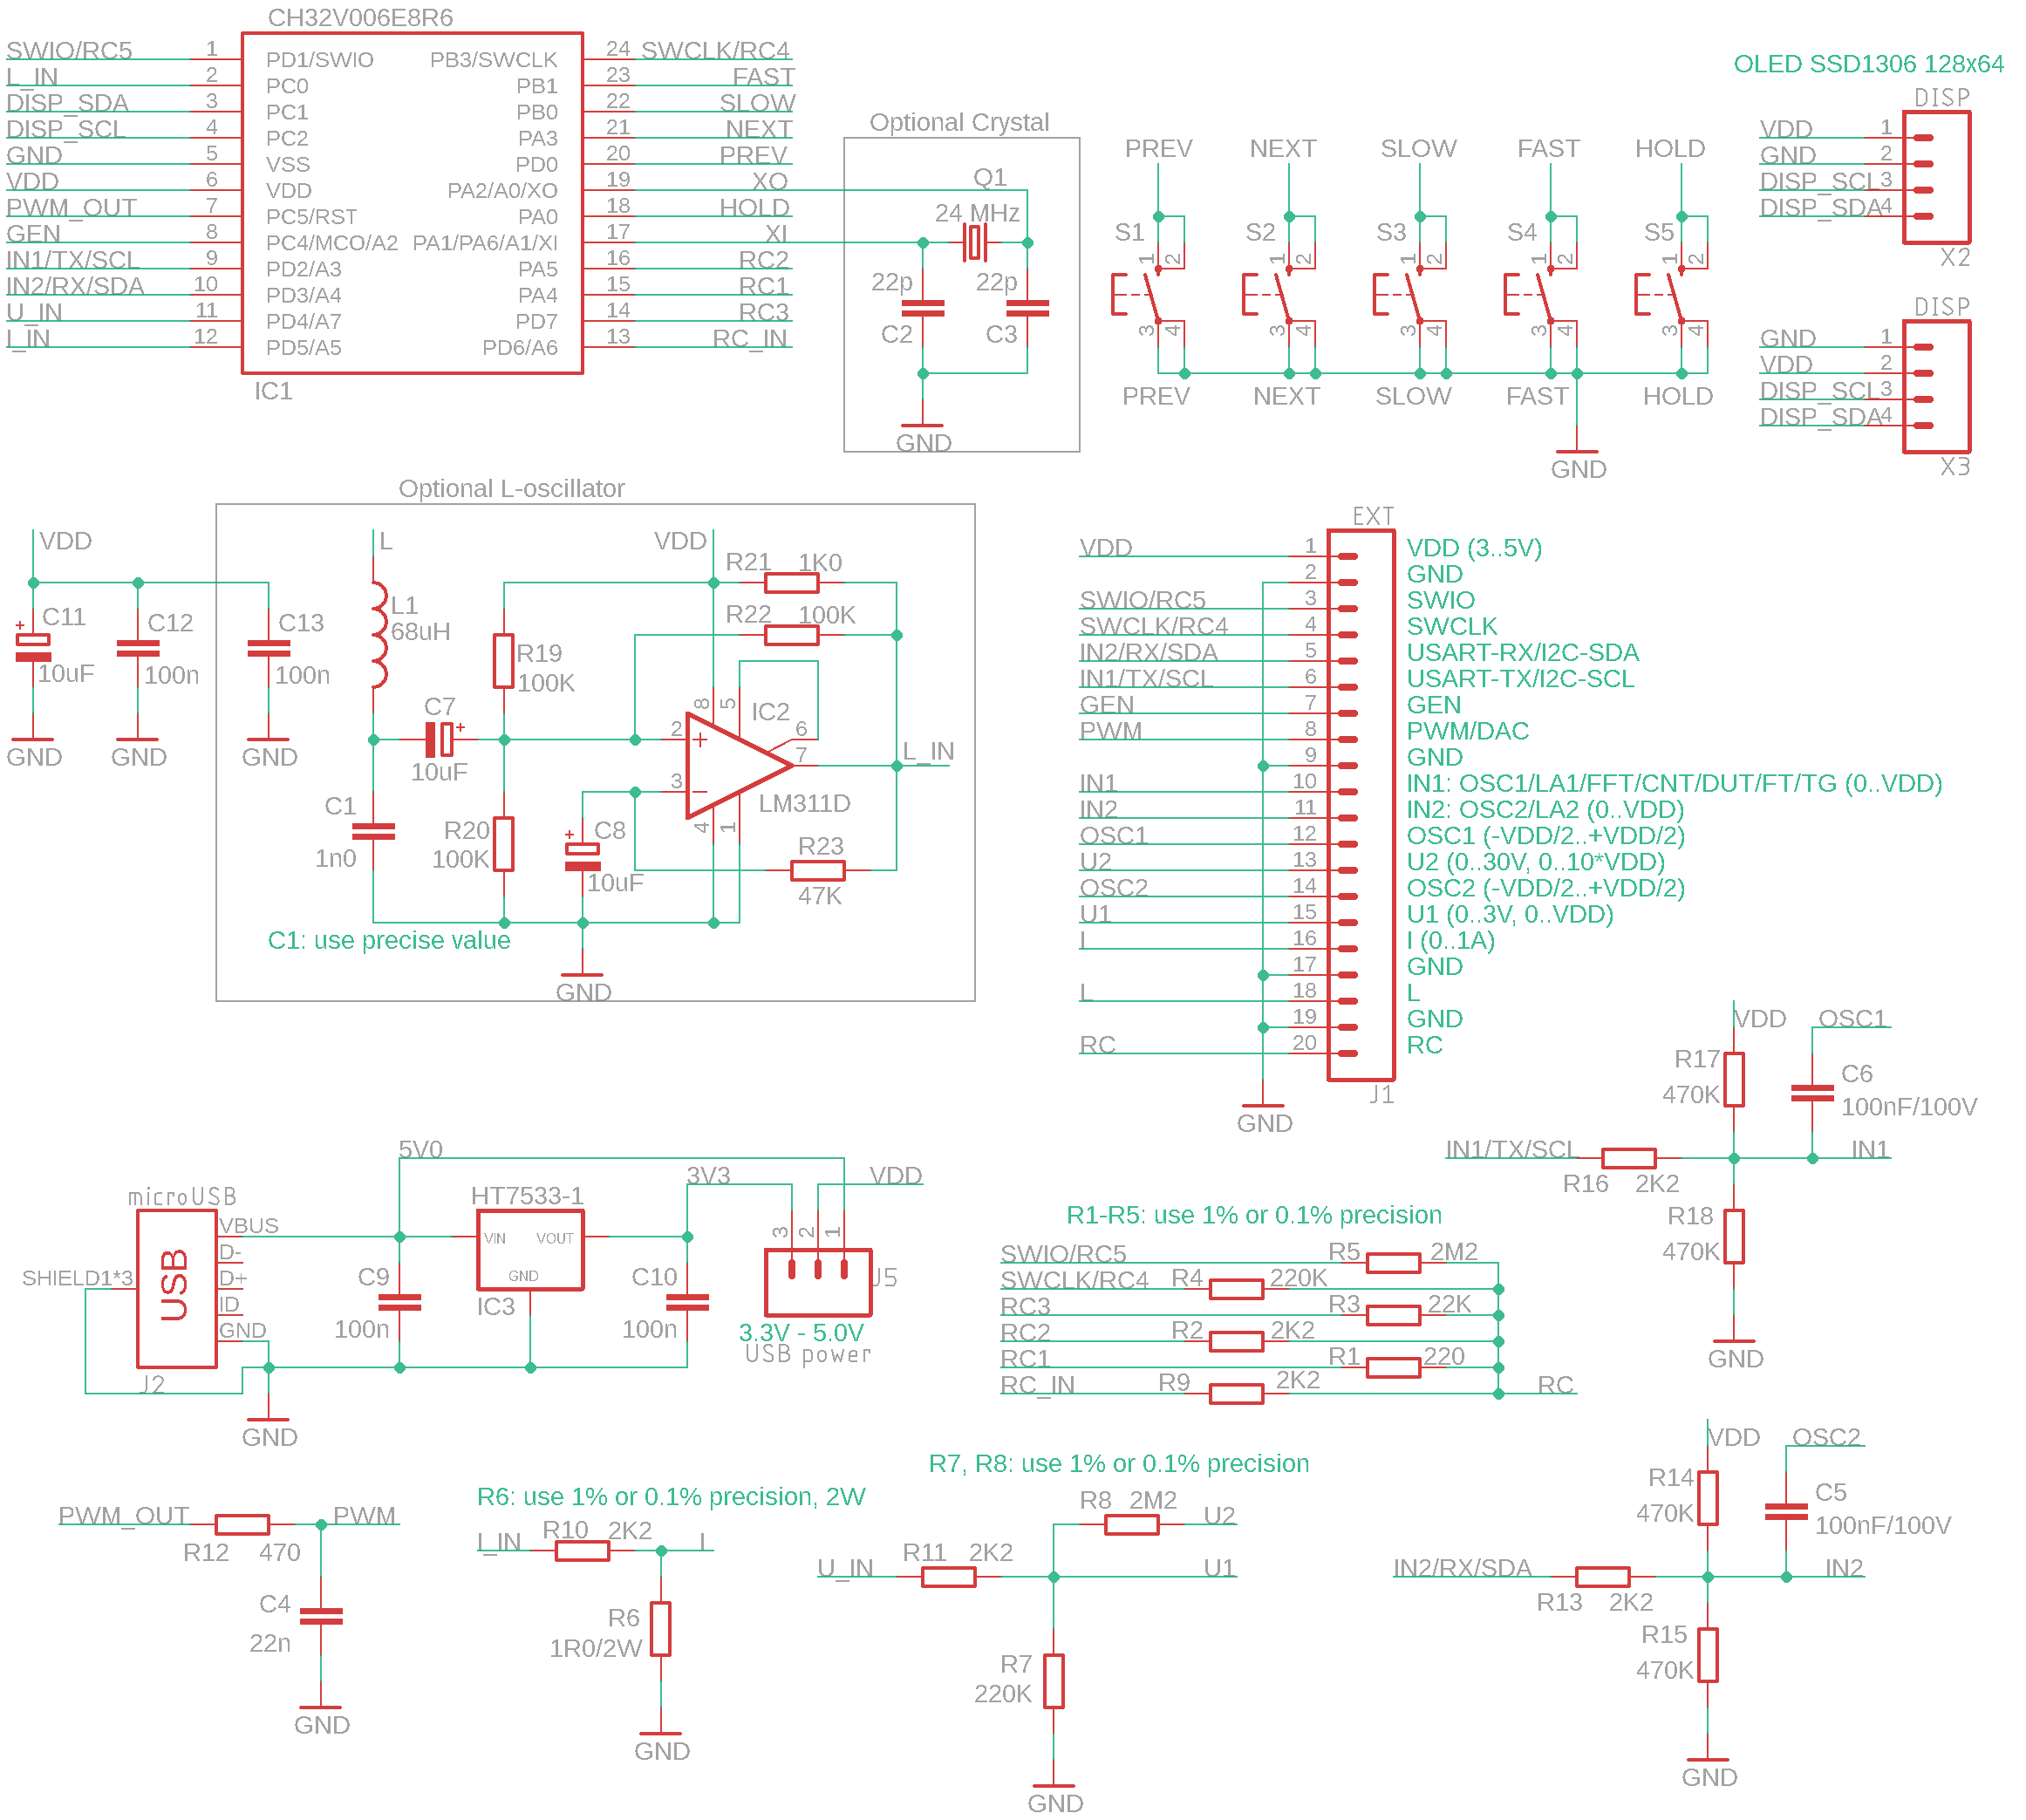
Two positions are reserved for the display on the printed circuit board, differing in the order of the VDD and GND signals. The recommended OLED display has a GND-VCC pin order, so it is placed in the lower position. A front cover with labels is also prepared for the same position. Some OLED displays have a VCC-GND pin order and must therefore be placed in the upper position. There is no front cover for the upper position - the display cutout must be moved.
When assembling the printed circuit board, first install the USB power supply section, i.e., the USB connector and HT7533 stabilizer. Pay close attention to the pin order for the stabilizer, as different manufacturers use different pin orders for this stabilizer. Even retailers may sometimes provide a datasheet from another manufacturer and therefore with the wrong pin order. Therefore, first install the USB power supply part and check the voltage - the voltage must be 5V before the stabilizer and 3.3V after the stabilizer. If this is not the case, the stabilizer is probably soldered in the wrong direction.
I recommend using the printed circuit board shown here only if you have no other option with a better design. The purpose of this design was to create a prototype for the possibility of programming PidiMet. However, the design is adapted to the fact that I manufacture printed circuit boards at home using a photochemical process - i.e., unnecessary through-holes and wiring are used, which would not be the case with a professional double-sided PCB. Probably due to poor design, there is also an error - sensitivity to high frequencies, such as occasional processor freezing when generating 24 and 48 MHz with a 5V power supply.
Schematics and printed circuit boards are in Eagle 9.2.0 Free format.
Note on the lifespan of OLED displays. It is commonly believed that these small OLED displays have a short lifespan. The reason for this is the excessive contrast that developers usually set. Contrast settings of 70 to 90% are often seen in configurations. Overexposure greatly reduces the lifespan of LEDs. I use a contrast of 5 to 10% - the brightness drops only slightly, the current drops to 30 to 50%, and the lifespan of the OLED is significantly increased.
Miroslav Nemecek